Advertisements
Advertisements
प्रश्न
Following is the distribution of marks of 70 students in a periodical test:
| Marks | Less than 10 | Less than 20 | Less than 30 | Less than 40 | Less than 50 |
| Number of students | 3 | 11 | 28 | 48 | 70 |
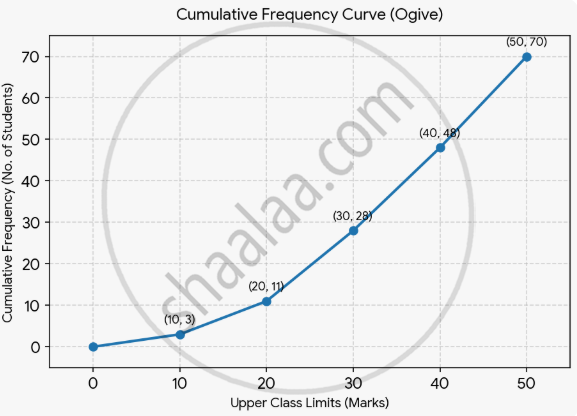
Draw a cumulative frequency curve for the above data.
आलेख
Advertisements
उत्तर
1. Identify upper class limits
The given distribution is already formatted in a “less than” cumulative style. The values given under “Marks” represent the upper boundaries of each class interval, and the “Number of students” represents the cumulative frequencies (cf):
| Upper Limit (Marks) |
Cumulative Frequency (cf) |
Coordinate Point (X, Y) |
| 10 | 3 | (10, 3) |
| 20 | 11 | (20, 11) |
| 30 | 28 | (30, 28) |
| 40 | 48 | (40, 48) |
| 50 | 70 | (50, 70) |
2. Plot the curve
Choose an appropriate scale for both axes (e.g., 1 cm = 10 units) Plot the points on a graph sheet, optionally beginning at the origin baseline (0, 0) and join them consecutively with a smooth, freehand curve to construct the ogive.
shaalaa.com
क्या इस प्रश्न या उत्तर में कोई त्रुटि है?
