Advertisements
Advertisements
प्रश्न
Find the median of the following data by making a ‘less than ogive’.
| Marks | 0 - 10 | 10-20 | 20 - 30 | 30 - 40 | 40 - 50 | 50 - 60 | 60 - 70 | 70 - 80 | 80-90 | 90-100 |
| Number of Students | 5 | 3 | 4 | 3 | 3 | 4 | 7 | 9 | 7 | 8 |
Advertisements
उत्तर
The frequency distribution table of less than type is given as follows:
| Marks (upper class limits) | Cumulative frequency (cf) |
| Less than 10 | 5 |
| Less than 20 | 5 + 3 = 8 |
| Less than 30 | 8 + 4 = 12 |
| Less than 40 | 12 + 3 = 15 |
| Less than 50 | 15 + 3 = 18 |
| Less than 60 | 18 + 4 = 22 |
| Less than 70 | 22 + 7 = 29 |
| Less than 80 | 29 + 9 = 38 |
| Less than 90 | 38 + 7 = 45 |
| Less than 100 | 45 + 8 = 53 |
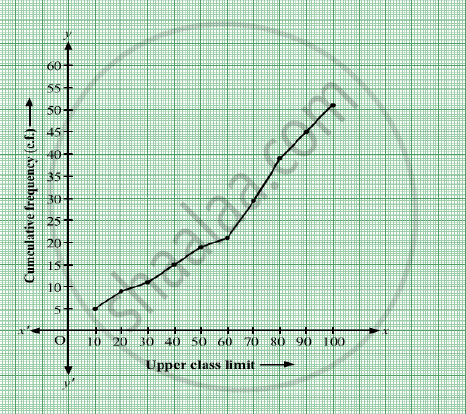
Taking upper class limits of class intervals on x-axis and their respective frequencies on y-axis, its ogive can be drawn as follows:
Here, N = 53 ⇒ `N/2` = 26.5.
Mark the point A whose ordinate is 26.5 and
its x-coordinate is 66.4.
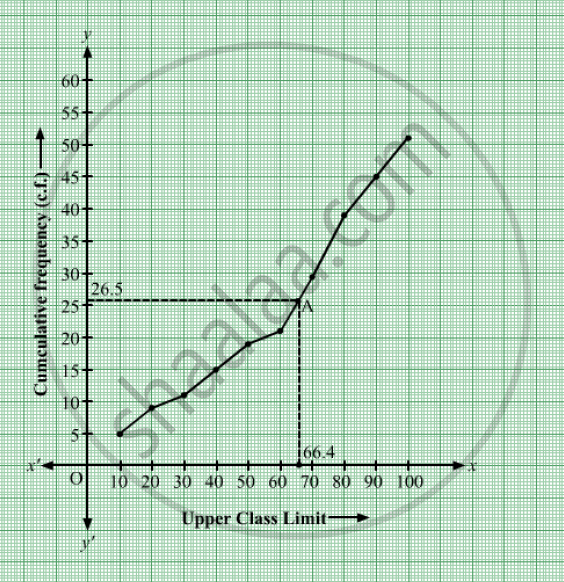
Thus, median of the data is 66.4.
shaalaa.com
क्या इस प्रश्न या उत्तर में कोई त्रुटि है?
