Advertisements
Advertisements
प्रश्न
Express the truth of the following statement by the Venn diagram.
No child is an adult.
Advertisements
उत्तर
U : Set of all human beings.
C : Set of all child.
A : Set of all Adult.

The above Venn diagram represents the truth of the given statement, i.e. C ∩ A = Φ
APPEARS IN
संबंधित प्रश्न
Draw appropriate Venn diagram for the following:
(A ∪ B)'
If A and B are two set such that \[A \subset B\]then find:
\[A \cap B\]
If A = {1, 2, 3, 4, 5}, B = {4, 5, 6, 7, 8}, C = {7, 8, 9, 10, 11} and D = {10, 11, 12, 13, 14}, find:
\[B \cup C\]
If A = {1, 2, 3, 4, 5}, B = {4, 5, 6, 7, 8}, C = {7, 8, 9, 10, 11} and D = {10, 11, 12, 13, 14}, find:
\[\left( A \cap B \right) \cap \left( B \cap C \right)\]
Let \[A = \left\{ x: x \in N \right\}, B = \left\{ x: x - 2n, n \in N \right\}, C = \left\{ x: x = 2n - 1, n \in N \right\}\] and D = {x : x is a prime natural number}. Find: \[A \cap D\]
Let \[A = \left\{ x: x \in N \right\}, B = \left\{ x: x - 2n, n \in N \right\}, C = \left\{ x: x = 2n - 1, n \in N \right\}\] and D = {x : x is a prime natural number}. Find: \[C \cap D\]
Let A = {3, 6, 12, 15, 18, 21}, B = {4, 8, 12, 16, 20}, C = {2, 4, 6, 8, 10, 12, 14, 16} and D = {5, 10, 15, 20}. Find: \[C - A\]
Let A = {3, 6, 12, 15, 18, 21}, B = {4, 8, 12, 16, 20}, C = {2, 4, 6, 8, 10, 12, 14, 16} and D = {5, 10, 15, 20}.
Find: \[B - C\]
Take the set of natural numbers from 1 to 20 as universal set and show set Y using Venn diagram.
Y = {y | y ∈ N, y is prime number from 1 to 20}
Express the truth of each of the following statements using Venn diagrams:
(a) No circles are polygons
(b) Some quadratic equations have equal roots
Express the truth of each of the following statements using Venn diagram.
(1) All teachers are scholars and scholars are teachers.
(2) If a quadrilateral is a rhombus then it is a parallelogram..
From the given diagram find :
A ∪ B
From the given diagram find :
A' ∩ B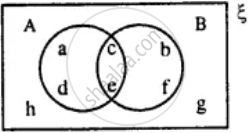
From the given diagram, find:
(i) A’
(ii) B’
(iii) A' ∪ B'
(iv) (A ∩ B)'
Is A' ∪ B' = (A ∩ B)' ?
Also, verify if A' ∪ B' = (A ∩ B)'.
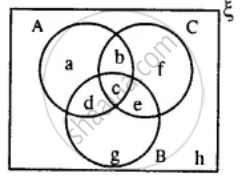
Use the given diagram to find:
(i) A ∪ (B ∩ C)
(ii) B - (A - C)
(iii) A - B
(iv) A ∩ B'
Is A ∩ B' = A - B?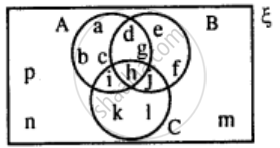
Use the given Venn-diagram to find:
B - A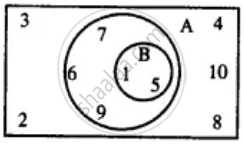
Use the given Venn-diagram to find :
A
Draw a Venn-diagram to show the relationship between two overlapping sets A and B. Now shade the region representing :
B - A
Draw a Venn-diagram to show the relationship between two sets A and B; such that A ⊆ B, Now shade the region representing :
A ∪ B
Two sets A and B are such that A ∩ B = Φ. Draw a venn-diagram to show the relationship between A and B. Shade the region representing :
A ∪ B
Two sets A and B are such that A ∩ B = Φ. Draw a venn-diagram to show the relationship between A and B. Shade the region representing :
(A ∪ B)'
From the given diagram, find :
(i) (A ∪ B) - C
(ii) B - (A ∩ C)
(iii) (B ∩ C) ∪ A
Verify :
A - (B ∩ C) = (A - B) ∪ (A - C)
Represent the truth of the following statement by the Venn diagram.
Some hardworking students are obedient.
Draw a Venn diagram for the truth of the following statement.
Some share brokers are chartered accountants.
Draw the Venn diagrams to illustrate the following relationship among sets E, M and U, where E is the set of students studying English in a school, M is the set of students studying Mathematics in the same school, U is the set of all students in that school.
There is no student who studies both Mathematics and English.
Draw Venn diagram for the following:
Some doctors are rich
