Advertisements
Advertisements
प्रश्न
Explain the relationship between average cost and marginal cost with the help of an appropriate diagram.
What is the relationship between Average cost and Marginal cost of production?
Explain the mutual relationship between average cost and marginal cost.
Explain the relationship between Average Cost and Marginal Cost with the help of a table and diagram.
Explain, with the help of a diagram, the relationship between average cost and marginal cost.
आकृति
स्पष्ट कीजिए
विस्तार में उत्तर
Advertisements
उत्तर
Relationship Between Average Cost and Marginal Cost:
- When MC < AC
- Average Cost falls.
- This means the cost of producing an extra unit is less than the average, so the average gets pulled down.
- Example: Like when adding a lower score to your average lowers your total average score.
- When MC = AC
- Average Cost is at its minimum point and remains constant for a moment.
- At this point, the MC curve cuts the AC curve from below.
- When MC > AC
- Average Cost rises.
- This is because the extra unit costs more than the average, pulling the average up.
Table:
| Output (Q) | Total Cost | Average Cost `bb(AC = (TC)/Q)` | Marginal Cost `bb(MC = (ΔTC)/(ΔQ))` |
| 1 | 50 | 50.0 | - |
| 2 | 90 | 45.0 | 40 |
| 3 | 120 | 40.0 | 30 |
| 4 | 140 | 35.0 | 20 |
| 5 | 160 | 32.0 | 20 |
| 6 | 183 | 30.5 | 23 |
| 7 | 210 | 30.0 | 27 |
| 8 | 240 | 30.0 | 30 |
| 9 | 275 | 30.6 | 35 |
Analysis of the Table:
- AC is falling as long as MC is below AC (from output 1 to 6).
- AC reaches a minimum when MC = AC (at outputs 7 and 8).
- AC rises when MC exceeds AC (from output 9 onward).
Diagram:
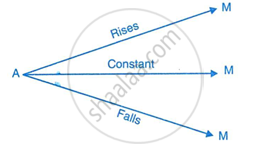
- The horizontal line shows AC is constant when MC = AC.
- The downward-sloping arrow shows AC is falling when MC < AC.
- The upward-sloping arrow shows AC is rising when MC > AC.
shaalaa.com
Notes
Students should refer to the answer according to their questions.
क्या इस प्रश्न या उत्तर में कोई त्रुटि है?
