Advertisements
Advertisements
प्रश्न
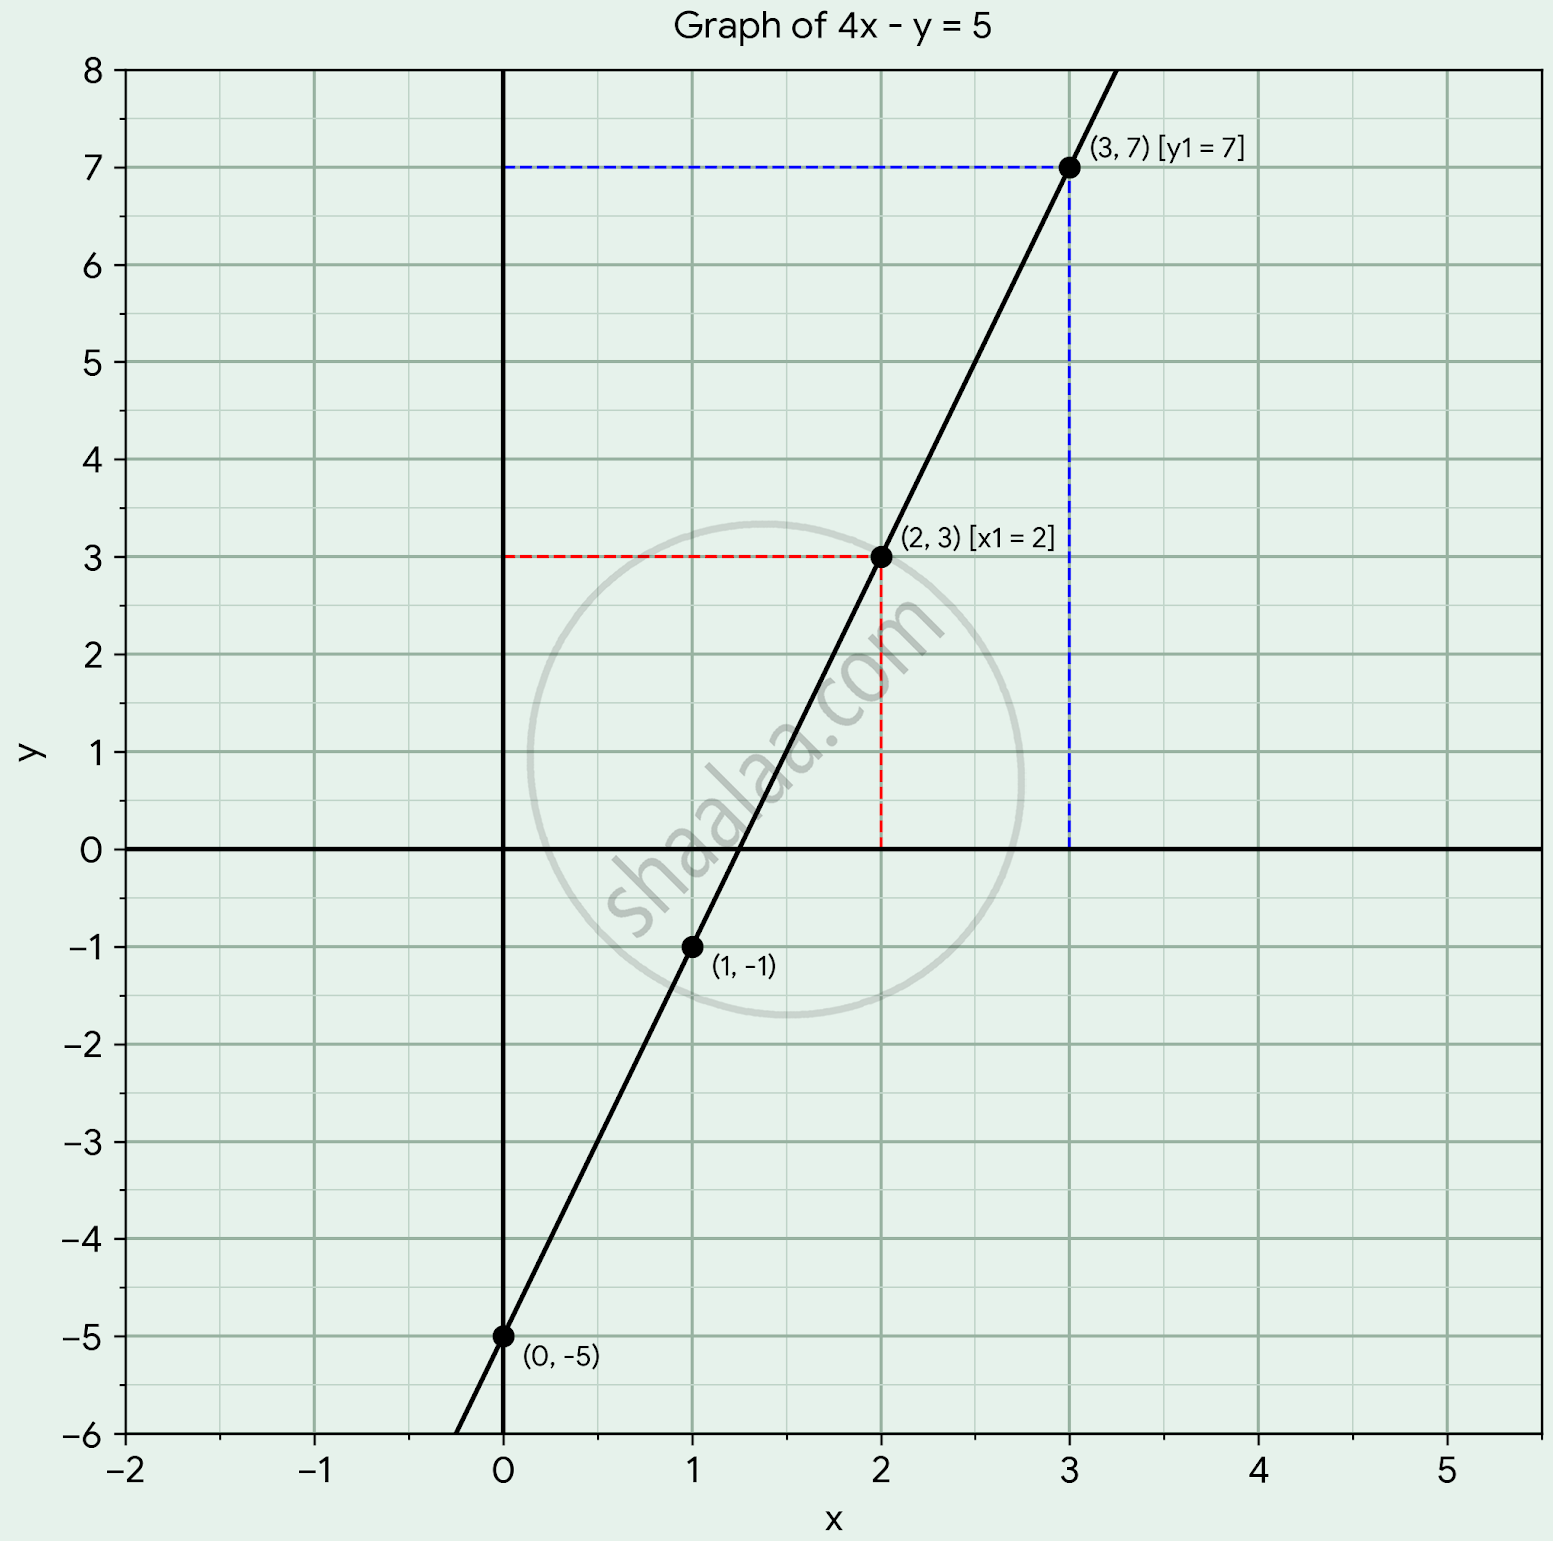
Draw the graph of line 4x − y = 5. Use this graph to find:
- x1, the value of x when y = 3.
- y1, the value of y, when x = 3.
Advertisements
उत्तर
Given:
Equation of the line is 4x − y = 5, with sub-parts to find x1 when y = 3 and y1 when x = 3
Formula:
y = 4x − 5
Solution:
4(0) − y = 5 ⇒ y = −5 [Calculating y when x = 0 to find point (0, −5)]
4(1) − y = 5 ⇒ y = −1 [Calculating y when x = 1 to find point (1, −1)]
4(2) − y = 5 ⇒ y = 3 [Calculating y when x = 2 to find point (2, 3)]
4(3) − y = 5 ⇒ y = 7 [Calculating y when x = 3 to find point (3, 7)]
4x1 − 3 = 5 [Substituting y = 3 into the equation to find x1]
4x1 = 8 [Transposing −3 to the right side}]
∴ x1 = 2 [Dividing both sides by 4 to get x1]
4(3) − y1 = 5 [Substituting x = 3 into the equation to find y1]
12 − y1 = 5 [Multiplying 4 by 3]
∴ y1 = 12 − 5 = 7 [Transposing terms to solve for y1]
∴ x1 = 2 and y1 = 7
