Advertisements
Advertisements
प्रश्न
Draw a histogram from the following frequency distribution and find the mode from the graph:
| Class | 0-5 | 5-10 | 10-15 | 15-20 | 20-25 | 25-30 |
| Frequency | 2 | 5 | 18 | 14 | 8 | 5 |
आलेख
योग
Advertisements
उत्तर १
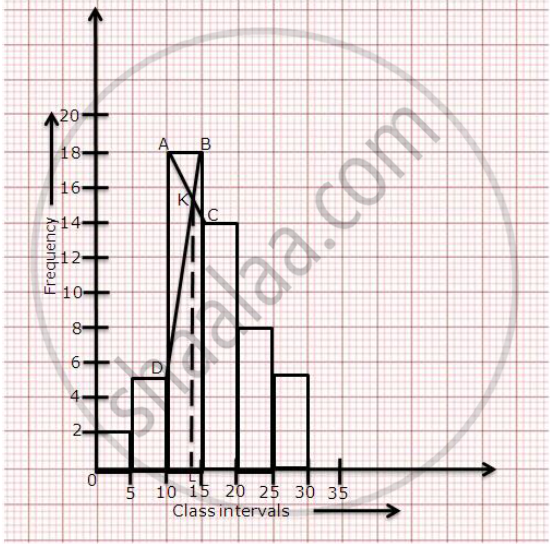
Steps for calculation of mode.
(1) Mark the endpoints of the upper corner of the rectangle with maximum frequency
as A and B.
(2) Mark the inner corner of adjacent rectangles as C and D.
(3) Join AC and BD to intersect at K. From K, draw KL perpendicular to the x-axis.
(4) The value of L on the x-axis represents the mode. Thus, Mode = 13
shaalaa.com
उत्तर २
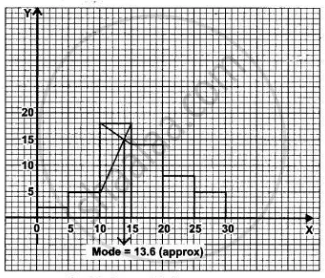
Mode = 13·6
shaalaa.com
क्या इस प्रश्न या उत्तर में कोई त्रुटि है?
