Advertisements
Advertisements
प्रश्न
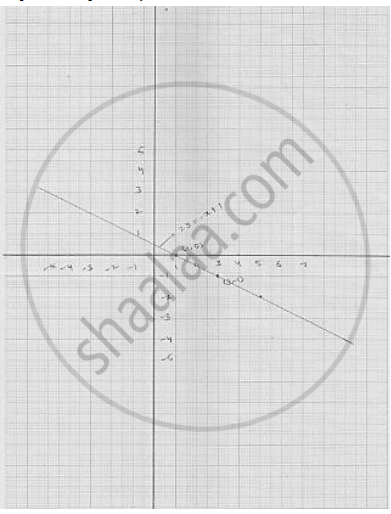
Draw the graph of the following linear equations in two variable : 2𝑦 = −𝑥 + 1
Advertisements
उत्तर
we have
`2y = -x + 1`
⇒ x -1 = 2y ............. (1)
Putting y = 0 , we get x = 1 - 2 × 0 = 1
Putting y = -1 , we get x = 1 - 2 ( - 1) = 3
Thus, we have the following table giving the two points on the line represented by
the equation
2y = x - 3
2y = - x + 1
Graph for the equation 2y = - x +1
shaalaa.com
क्या इस प्रश्न या उत्तर में कोई त्रुटि है?
