Advertisements
Advertisements
प्रश्न
Draw and explain the Logistic population growth curve.
आकृति
स्पष्ट कीजिए
Advertisements
उत्तर
The logistic population growth curve is an S-shaped (sigmoid) curve. In this, the population first grows slowly, then increases rapidly, and finally the growth slows down due to environmental limits until it reaches a stable level. This stable level represents the maximum population size that the environment can support.
Logistic Growth
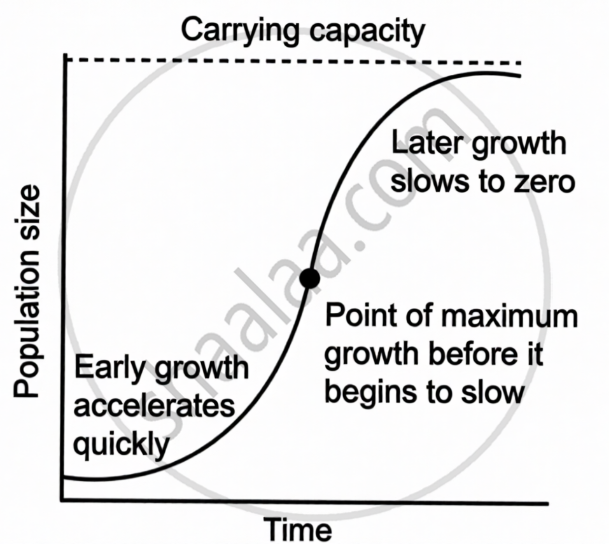
Phases:
- Lag Phase: Slow growth due to small population size.
- Exponential Phase: Rapid growth due to abundant resources. Deceleration Phase: Growth slows down due to competition and limited resources.
- Stationary Phase: Population stabilise at carrying capacity (K).
The logistic growth equation is:
`(dN)/(dt) = rN((K − N)/K)`
`(dN)/(dt)` = growth rate of population (N = population size, t = time).
shaalaa.com
क्या इस प्रश्न या उत्तर में कोई त्रुटि है?
2024-2025 (March) Official Board
