Advertisements
Advertisements
प्रश्न
Describe diagrammatic representation of age structure showing declining population.
Advertisements
उत्तर
a. The relative proportion of individuals of various age groups in the population is called
age structure of the population.
b. Age structure of a population is the percentage of individuals of different age groups such as young (0-14 years), adults (15-59 years) and old (60 years and above).
c. The distribution of these age groups determine the trend of population.

d. In declining population, number of post reproductive age group is large whereas the number of pre reproductive age group is small.
e. Thus, the age structure shows declining population.
APPEARS IN
संबंधित प्रश्न
With the help of suitable diagrams, explain how the age structures determine the trend of population.
Define the term natality.
Describe the qualitative aspects of population.
Complete the given analogy.
Mortality: No. of deaths in a population during a given period:: Emigration: ____________.
The number of individuals of population who left the habitat during the time period under consideration is known as ______.
The type of population represented in the given age pyramid is ______.

What will be the birth rate per individual per hour of a population of 50 Paramoecium present in a pool. The population of Paramoecium increases to 150 within an hour.
A population is a group of all ____________ in a given time.
How many national parks and sanctuaries are present in Maharashtra?
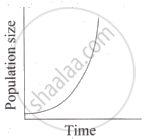
The above graph indicates ______ with relation to population.
