Advertisements
Advertisements
प्रश्न
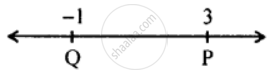
Compare: 3 and -1
Advertisements
उत्तर
3 and -1
Since, P is on the right of Q.
⇒ 3 > -1
APPEARS IN
संबंधित प्रश्न
Add the following rational numbers.
What should be added to \[\frac{- 7}{8}\] so as to get \[\frac{5}{9}?\]
Simplify each of the following and write as a rational number of the form \[\frac{p}{q}:\]\[\frac{- 11}{2} + \frac{7}{6} + \frac{- 5}{8}\]
Simplify:
Simplify each of the following and express the result as a rational number in standard form:
Simplify each of the following and express the result as a rational number in standard form:
Insert three rational number between:
-5 and -4
Find the greatest and the smallest rational number among the following.
`(6)/(7),(9)/(14) and (23)/(28)`
Select those which can be written as a rational number with denominator 4 in their lowest form:
`7/8, 64/16, 36/(-12), (-16)/17, 5/(-4), 140/28`
If p = m × t and q = n × t, then `p/q = square/square`
