Advertisements
Advertisements
प्रश्न
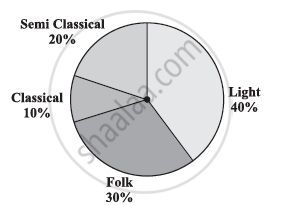
A survey was made to find the type of music that a certain group of young people liked in a city. Adjoining pie chart shows the findings of this survey.
From this pie chart answer the following:
- If 20 people liked classical music, how many young people were surveyed?
- Which type of music is liked by the maximum number of people?
- If a cassette company were to make 1000 CD’s, how many of each type would they make?
Advertisements
उत्तर
i) Number of people who like classical music = 10%
This 10% represents 20 people.
100 % represents = `(20 xx 100)/10 = 200` people
Therefore, 200 young people were surveyed.
ii) From the pie chart, it can be easily observed that the light music is represented by the maximum part of the pie chart (i.e., 40 %). Hence, most people like light music.
iii) Number of CD’s of classical music = 10% of 1000
= `10/100 xx 1000`
= 100
Number of CD’s of semi-classical music = 20% of 1000
= `20/100 xx 1000`
= 200
Number of CD’s of folk music = 30% of 1000
= `30/100 xx 1000`
= 300
Number of cassettes of light music = 40% of 1000
= `40/100 xx 1000`
= 400
