Advertisements
Advertisements
प्रश्न
A student performed some crosses in plants and represented the result in the form of bar graphs as shown below. Each graph displays the phenotypic proportion of the progeny. Study the graphs and answer the questions:
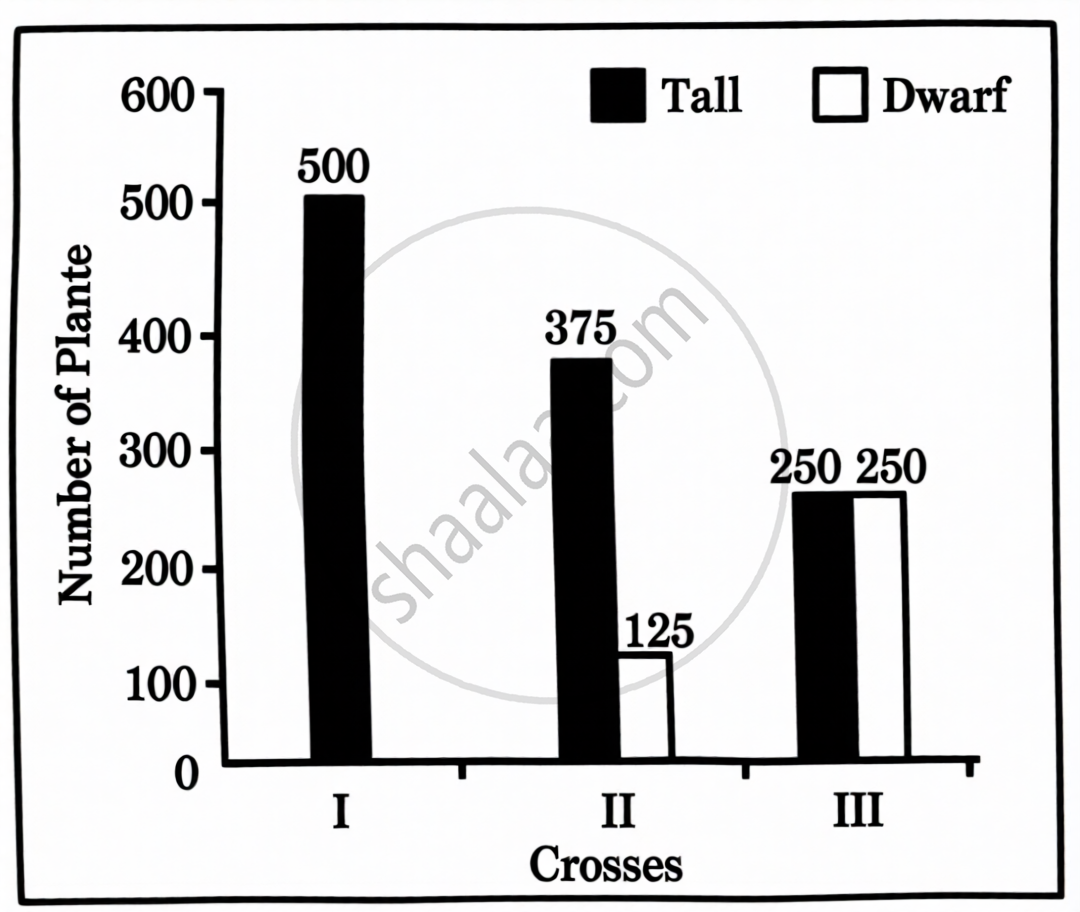
(a) What can you infer about the genotype of parents in crosses I and II? [1]
OR
(a) Which genetic cross is represented by these crosses? [1]
(b) Looking at bar graph of cross III, identify the type of cross performed and its importance in genetics. [2]
(c) What conclusion can you draw from the results of bar graphs of crosses I and II? Name the genetic principle illustrated. [1]
Advertisements
उत्तर
(a) Cross I: parents are true‑breeding (homozygous) for opposite traits, one TT (tall) × one tt (dwarf), so all F1 are tall (Tt).
OR
(a) These graphs represent a monohybrid Mendelian cross (dominant–recessive trait).
(b) Cross III shows 250 tall: 250 dwarf (1:1). This is a test‑cross of a heterozygote (Tt) crossed with a homozygous recessive (tt), giving 1:1 progeny. Test crosses are used to determine whether an individual showing the dominant phenotype is homozygous or heterozygous and to confirm Mendelian segregation.
(c) From I and II, we conclude that tallness is dominant to dwarfness and alleles segregate, so the F2 shows a 3:1 phenotypic ratio (tall: dwarf), illustrating Mendel’s law of segregation.
