Advertisements
Advertisements
Study the following table carefully to answer the questions that follow:
NUMBER OF BOYS AND GIRLS IN FIVE STREAMS OF A COLLEGE OVER THE YEARS STREAMS
| Year | Arts | Science | Commerce | Management | IT | |||||
| Boys | Girls | Boys | Girls | Boys | Girls | Boys | Girls | Boys | Girls | |
| 2002 | 556 | 414 | 619 | 505 | 668 | 612 | 770 | 633 | 670 | 515 |
| 2003 | 763 | 608 | 793 | 612 | 781 | 616 | 667 | 439 | 866 | 722 |
| 2004 | 672 | 519 | 540 | 516 | 859 | 713 | 778 | 727 | 781 | 619 |
| 2005 | 809 | 602 | 928 | 908 | 870 | 811 | 849 | 729 | 977 | 817 |
| 2006 | 745 | 510 | 884 | 820 | 967 | 819 | 562 | 938 | 990 | 808 |
| 2007 | 698 | 413 | 765 | 616 | 571 | 515 | 1288 | 1016 | 1151 | 1010 |
The number of boys in Arts stream in the year 2004 is approximately what per cent of the total number of boys for all the years together in Arts stream?
Concept: undefined >> undefined
Study the following table carefully to answer the questions that follow:
NUMBER OF BOYS AND GIRLS IN FIVE STREAMS OF A COLLEGE OVER THE YEARS STREAMS
| Year | Arts | Science | Commerce | Management | IT | |||||
| Boys | Girls | Boys | Girls | Boys | Girls | Boys | Girls | Boys | Girls | |
| 2002 | 556 | 414 | 619 | 505 | 668 | 612 | 770 | 633 | 670 | 515 |
| 2003 | 763 | 608 | 793 | 612 | 781 | 616 | 667 | 439 | 866 | 722 |
| 2004 | 672 | 519 | 540 | 516 | 859 | 713 | 778 | 727 | 781 | 619 |
| 2005 | 809 | 602 | 928 | 908 | 870 | 811 | 849 | 729 | 977 | 817 |
| 2006 | 745 | 510 | 884 | 820 | 967 | 819 | 562 | 938 | 990 | 808 |
| 2007 | 698 | 413 | 765 | 616 | 571 | 515 | 1288 | 1016 | 1151 | 1010 |
What is the average number of Girls from Commerce stream for the given years?
Concept: undefined >> undefined
Advertisements
Study the following table to answer the given questions.
Number of Students passing with different Divisions (I, II, III) from different Institutes (A, B, C) in different years
| Institute | A | B | C | ||||||
| Year/Division | I | II | III | I | II | III | I | II | III |
| 2001 | 20 | 55 | 53 | 13 | 46 | 80 | 16 | 53 | 32 |
| 2000 | 18 | 49 | 68 | 10 | 41 | 79 | 13 | 50 | 31 |
| 1999 | 22 | 46 | 71 | 11 | 44 | 88 | 14 | 51 | 33 |
| 1998 | 19 | 55 | 75 | 11 | 42 | 84 | 13 | 52 | 32 |
| 1997 | 8 | 50 | 70 | 9 | 40 | 80 | 11 | 50 | 30 |
What is the difference between total students passed with II Division between Institutes A and B?
Concept: undefined >> undefined
Study the following table to answer the given questions.
Number of Students of different classes of a school playing different games.
| Games/Class | XII | XI | x | IX | VIII | VII | VI |
| Chess | 11 | 12 | 5 | 4 | 2 | 2 | 1 |
| Cricket | 38 | 40 | 12 | 17 | 25 | 18 | 20 |
| Basket Ball | 11 | 9 | 7 | 6 | 0 | 0 | 0 |
| Table Tennis | 9 | 9 | 21 | 19 | 11 | 9 | 0 |
| Foot Ball | 40 | 27 | 18 | 19 | 12 | 16 | 14 |
| Carrom | 16 | 15 | 8 | 19 | 12 | 16 | 14 |
| Tennis | 8 | 9 | 11 | 5 | 6 | 0 | 0 |
| Badminton | 47 | 39 | 33 | 21 | 19 | 0 | 0 |
Which game is the most popular?
Concept: undefined >> undefined
Study the following table to answer the given questions.
Number of Students of different classes of a school playing different games.
| Games/Class | XII | XI | x | IX | VIII | VII | VI |
| Chess | 11 | 12 | 5 | 4 | 2 | 2 | 1 |
| Cricket | 38 | 40 | 12 | 17 | 25 | 18 | 20 |
| Basket Ball | 11 | 9 | 7 | 6 | 0 | 0 | 0 |
| Table Tennis | 9 | 9 | 21 | 19 | 11 | 9 | 0 |
| Foot Ball | 40 | 27 | 18 | 19 | 12 | 16 | 14 |
| Carrom | 16 | 15 | 8 | 19 | 12 | 16 | 14 |
| Tennis | 8 | 9 | 11 | 5 | 6 | 0 | 0 |
| Badminton | 47 | 39 | 33 | 21 | 19 | 0 | 0 |
Which game has ascending number of students from class IX to XII?
Concept: undefined >> undefined
Study the following table to answer these questions.
Percentage of marks obtained by 7 students in 6 subjects (maximum marks for each subject are shown in brackets)
| Student/Subject | H (75) |
G (60) |
M (80) |
S (50) |
E (40) |
H (40) |
| P | 86 | 82 | 95 | 78 | 66 | 84 |
| 9 | 92 | 78 | 85 | 89 | 72 | 76 |
| R | 76 | 94 | 89 | 75 | 62 | 69 |
| T | 67 | 74 | 74 | 84 | 85 | 82 |
| M | 74 | 86 | 64 | 80 | 78 | 72 |
| L | 88 | 89 | 76 | 88 | 70 | 64 |
| N | 90 | 96 | 86 | 92 | 65 | 66 |
What is the over all percentage of marks obtained by M in all the subjects (rounded off to two digits after decimal)?
Concept: undefined >> undefined
Answer the questions based on the following information.
Given below are two tables. Table I shows the % market share of five wheat producing firms – A, B, C, D and E. in total sales revenue. Table II shows the % market share of A, B, C, D and E in quantity of wheat sold.
It is known that the total sales revenue was 2643 million rupees while total quantity sold was 1.65 million tonites.
| Table I. (% SALES REVENUE) | |
| Firm | Percentage |
| A | 30 |
| B | 16 |
| C | 23 |
| D | 27 |
| E | 4 |
| Table II. (% Quantity) | |
| Firm | Percentage |
| A | 32 |
| B | 18 |
| C | 19 |
| D | 26 |
| E | 5 |
Find the price of wheat in (₹/kg) for firm D.
Concept: undefined >> undefined
Study the following graph to answer the given questions.
Units Manufactured by two companies over the years (Number In thousands)
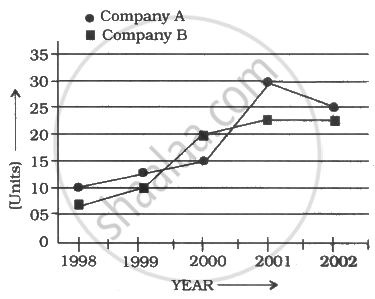
What is the difference in the total units manufactured by the two companies for the given years?
Concept: undefined >> undefined
Study the following graph carefully and answer the questions given below it.
Profit Earned by a Company during Vartou Years (Profit earned in lakhs)
Profit = Income – Expenditure

What is the average profit earned by the company over the years?
Concept: undefined >> undefined
Study the following table carefully to answer these questions:
Table giving percentage of unemployed male and female youth and the total population for different states in 2014 and 2015.
| 2014 | 2015 | |||||
| State | M | F | T | M | F | T |
| A | 12 | 15 | 32 | 7 | 8 | 35 |
| B | 8 | 7 | 18 | 10 | 9 | 20 |
| C | 9 | 10 | 28 | 10 | 12 | 34 |
| D | 10 | 6 | 24 | 8 | 8 | 30 |
| E | 6 | 8 | 30 | 7 | 6 | 32 |
| F | 7 | 5 | 28 | 8 | 7 | 35 |
M = Percentage of unemployed Male youth over total population
F = Percentage of unemployed Female youth over total population
T = Total population of the state in lakhs
Number of unemployed male youths in State A in 2014 was what per cent of the number of unemployed female youths in State E in 2015?
Concept: undefined >> undefined
Select the option figure, which when placed in the blank space of the figure marked 'X' would complete the pattern.
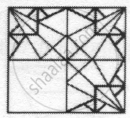
(X)
Concept: undefined >> undefined
Which country is hosting the World Sustainable Development Summit 2022?
Concept: undefined >> undefined
Pierre-Olivier Gourinchas has been named as the new Chief Economist of which international body?
Concept: undefined >> undefined
India adopted the ‘Digital Work Plan 2022’ along with which bloc?
Concept: undefined >> undefined
The currency of which of this country is NOT Euro?
Concept: undefined >> undefined
The G-20 group has how many members as its leaders?
Concept: undefined >> undefined
What is the full foam of IFFCO?
Concept: undefined >> undefined
World Trade Organization came into existence in ______.
Concept: undefined >> undefined
Which organization has launched the ‘JIVA programme’ to promote natural farming?
Concept: undefined >> undefined
A paper is folded and cut as shown below. How will it appear when unfolded?
 |
 |
 |
Concept: undefined >> undefined
