Advertisements
Advertisements
It was estimated that because of people switching to Metro trains, about 33000 tonnes of CNG, 3300 tonnes of diesel and 21000 tonnes of petrol was saved by the end of year 2007. Find the fraction of the quantity of diesel saved to the quantity of CNG saved.
Concept: undefined >> undefined
Put the right card in the right bag.
Card - `3/7`
Concept: undefined >> undefined
Advertisements
Put the right card in the right bag.
Card - `4/4`
Concept: undefined >> undefined
Put the right card in the right bag.
Card - `9/8`
Concept: undefined >> undefined
Put the right card in the right bag.
Card - `8/9`
Concept: undefined >> undefined
Put the right card in the right bag.
Card - `5/6`
Concept: undefined >> undefined
Put the right card in the right bag.
Card - `6/11`
Concept: undefined >> undefined
Put the right card in the right bag.
Card - `18/18`
Concept: undefined >> undefined
Put the right card in the right bag.
Card - `19/25`
Concept: undefined >> undefined
Put the right card in the right bag.
Card - `2/3`
Concept: undefined >> undefined
Put the right card in the right bag.
Card - `13/17`
Concept: undefined >> undefined
The number of ATMs of different banks in a city is shown below:
| Bank | Number of ATMs |
| Syndicate Bank | 5 |
| Dena Bank | 15 |
| Indian Bank | 20 |
| State Bank of India | 25 |
| Vijaya Bank | 10 |
Draw a bar graph to represent the above information by choosing the scale of your choice.
Concept: undefined >> undefined
The following table represents income of a Gram Panchayat from different sources in a particular year:
| Sources | Income (in Rs.) |
| Income from local taxes | 75000 |
| Funds received from government | 150000 |
| Donations | 25000 |
| Income from other resources | 50000 |
Draw a bar graph to represent the above information.
Concept: undefined >> undefined
The following table gives the data of number of schools (stage-wise) of a country in the year 2002.
| Stage | Number of schools (in thousands) |
| Primary | 80 |
| Upper Primary | 55 |
| Secondary | 30 |
| Higher Secondary | 20 |
Draw a bar graph to represent the above data:
Concept: undefined >> undefined
Home appliances sold by a shop in one month are given as below:
| Home appliance | Number of home appliances |
| Refrigerator | 75 |
| Television | 45 |
| Washing Machine | 30 |
| Cooler | 60 |
| DVD Player | 30 |
Draw a bar graph to represent the above information.
Concept: undefined >> undefined
In a botanical garden, the number of different types of plants are found as follows:
| Type of the plants | Number of plants |
| Herb | 50 |
| Shrub | 60 |
| Creeper | 20 |
| Climber | 45 |
| Tree | 95 |
Draw a bar graph to represent the above information and answer the following questions:
- Which type of plant is maximum in number in the garden?
- Which type of plant is minimum in number in the garden?
Concept: undefined >> undefined
In the following figure, all triangles are equilateral and AB = 8 units. Other triangles have been formed by taking the mid points of the sides. What is the perimeter of the figure?
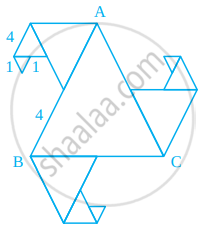
Concept: undefined >> undefined
The perimeter of a triangle is 28 cm. One of it’s sides is 8 cm. Write all the sides of the possible isosceles triangles with these measurements.
Concept: undefined >> undefined
The numbers 13 and 31 are prime numbers. Both these numbers have the same digits 1 and 3. Find such pairs of prime numbers up to 100.
Concept: undefined >> undefined
What is the greatest prime number between 1 and 10?
Concept: undefined >> undefined
