Please select a subject first
Advertisements
Advertisements
What is soil conservation? Suggest some measures to conserve soil.
Concept: undefined >> undefined
How are north Indian rivers different from Peninsular rivers?
Concept: undefined >> undefined
Advertisements
Which one of the following has the longest duration?
Concept: undefined >> undefined
Which one of the following is not related to the formation or modification of the present atmosphere?
Concept: undefined >> undefined
Life on the earth appeared around how many years before the present?
Concept: undefined >> undefined
What is meant by the process of differentiation?
Concept: undefined >> undefined
What was the nature of the earth surface initially?
Concept: undefined >> undefined
What were the gases which initially formed the earth’s atmosphere?
Concept: undefined >> undefined
List the stages in the evolution of the earth and explain each stage in brief.
Concept: undefined >> undefined
In which part of the Himalayas do we find the Karewa formation?
Concept: undefined >> undefined
In which of the following states is Loktak lake situated?
Concept: undefined >> undefined
If you move from Badrinath to Sunderbans delta along the course of the river Ganga, what major geomorphological features will you come across?
Concept: undefined >> undefined
What are the socio-economic advantages of the inter-linking of rivers in India?
Concept: undefined >> undefined
Which one of the following phenomenon happens when the sun shines vertically over the Tropic of Capricorn in the southern hemisphere?
Concept: undefined >> undefined
The primary tool for weather forecasting is______.
Concept: undefined >> undefined
What is a weather chart?
Concept: undefined >> undefined
Discuss how weather maps and charts are prepared.
Concept: undefined >> undefined
How weather maps and charts are useful to us?
Concept: undefined >> undefined
Study the following figures and answer the following questions.
- Which seasons are shown in these maps?
- What is the value of the highest isobar in Figure A and through which part of the country does it pass?
- What are the values of the highest and the lowest isobars in Figure B and where are they located?
- What are the patterns of temperature distribution in both the maps?
- In which parts do you see the highest and the lowest mean temperature in Figure A?
- What relationship do you see between the distribution of temperature and pressure in both the maps?
Figure A
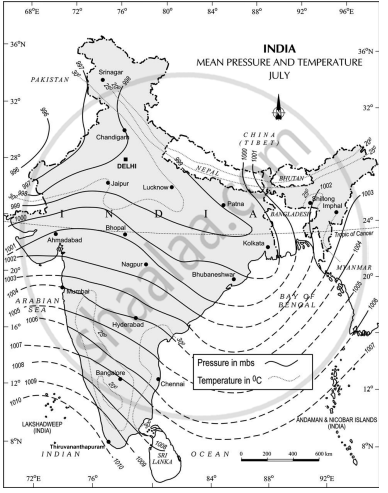
Figure B

Concept: undefined >> undefined
Which one of the following was the purpose of Project Tiger?
Concept: undefined >> undefined
