Advertisements
Advertisements
प्रश्न
With the help of the given statistical data, prepare a simple bar graph and answer the following questions:
| Brazil - Urban population in percentage (1960-2010) |
||||||
| Years | 1960 | 1970 | 1980 | 1990 | 2000 | 2010 |
| % of Urban population | 47.1 | 56.8 | 66.0 | 74.6 | 81.5 | 84.6 |
Questions:
- What is the interval of the data?
- Which decade shows decrease in the rate of urbanisation?
- What was the percentage of increase in the urban population from 1970 to 1980?
आलेख
अति संक्षिप्त उत्तर
Advertisements
उत्तर
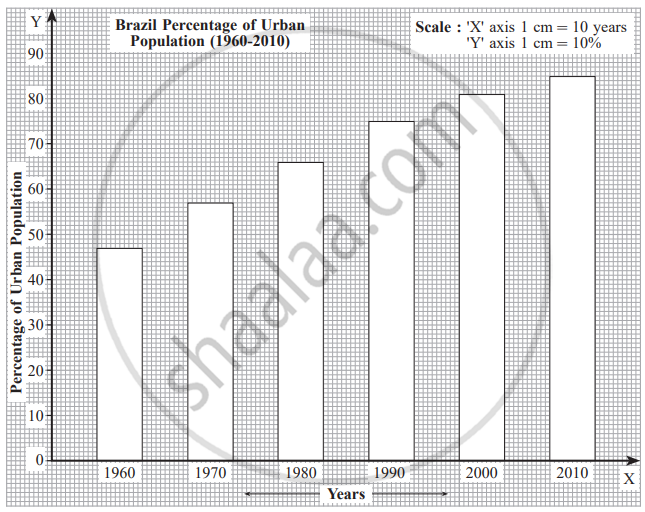
- The interval of the data is 10 years.
- The decade 2000 – 2010 shows a decrease in the rate of urbanisation.
- The urban population increased by 9.2% between 1970 and 1980.
shaalaa.com
या प्रश्नात किंवा उत्तरात काही त्रुटी आहे का?
