Advertisements
Advertisements
प्रश्न
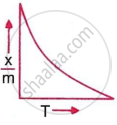
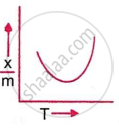
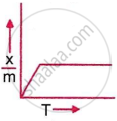
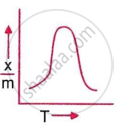
Which plot is the adsorption isobar for chemisorption, where x is the amount of gas adsorbed on mass m (at constant pressure) at temperature T?
पर्याय
MCQ
Advertisements
उत्तर
Explanation:
In chemisorption, the adsorption amount initially rises with temperature due to activation energy requirements, then falls as desorption dominates, producing a peak-shaped graph of `x/m` vs. T. This behaviour is characteristic of chemisorption adsorption isobars at constant pressure.
shaalaa.com
या प्रश्नात किंवा उत्तरात काही त्रुटी आहे का?
