Advertisements
Advertisements
प्रश्न
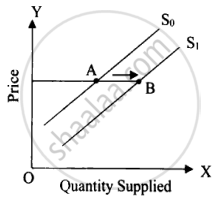
Which one of the following scenarios depicts the movement from A to B shown in the diagram below?
पर्याय
Rise in supply of tomato due to an increase in its price.
Rise in supply of t-shirts of brand Z following a fall in its price.
Fall in supply of fertilisers due to reduction in subsidy by the government.
Rise in supply of television by MG Electronics due to the use of Artificial Intelligence in its manufacturing.
MCQ
Advertisements
उत्तर
Rise in supply of television by MG Electronics due to the use of Artificial Intelligence in its manufacturing.
Explanation:
The diagram shows the entire supply curve shifting right from S0 to S1 so quantity supplied increases at the same price (movement from A to B), this is an increase in supply, not a movement along a curve.
shaalaa.com
या प्रश्नात किंवा उत्तरात काही त्रुटी आहे का?
2025-2026 (March) Official Board Paper
