मराठी

Which of the following diagram represents the situation of ‘Expansion in Demand’?

Advertisements
Advertisements

प्रश्न

Which of the following diagram represents the situation of ‘Expansion in Demand’?

पर्याय
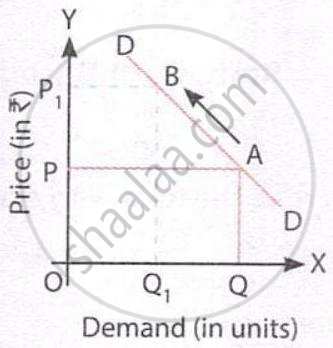
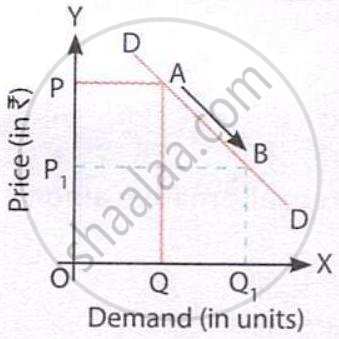
  • A fall in price from OP to OP₁ increases quantity demanded from OQ to OQ₁ along the same demand curve.

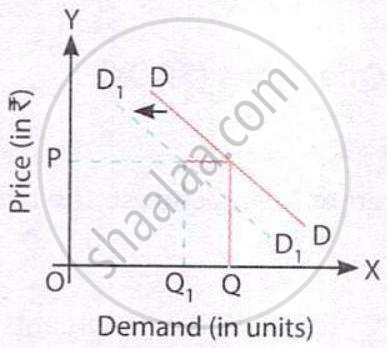
  • The demand curve shifts leftward from DD to D₁D₁, reducing quantity demanded from OQ to OQ₁ at the same price.

  • A rise in price from OP to OP₁ reduces quantity demanded from OQ to OQ₁ along the same demand curve.

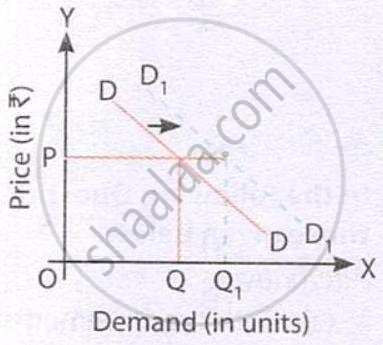
  • The demand curve shifts rightward from DD to D₁D₁, increasing quantity demanded from OQ to OQ₁ at the same price.

MCQ
Advertisements

उत्तर

A fall in price from OP to OP₁ increases quantity demanded from OQ to OQ₁ along the same demand curve.

Explanation:

Expansion in demand is an increase in quantity demanded due to a fall in own price, shown as downward movement along the same curve. The other diagrams show contraction or shifts in demand.

shaalaa.com
  या प्रश्नात किंवा उत्तरात काही त्रुटी आहे का?
पाठ 3: Demand - OBJECTIVE QUESTIONS [पृष्ठ ३.४३]

APPEARS IN

संदीप गर्ग Introductory Microeconomics [English] Class 11
पाठ 3 Demand
OBJECTIVE QUESTIONS | Q 47. | पृष्ठ ३.४३
Share
Notifications

Englishहिंदीमराठी


      Forgot password?
Use app×