Advertisements
Advertisements
प्रश्न
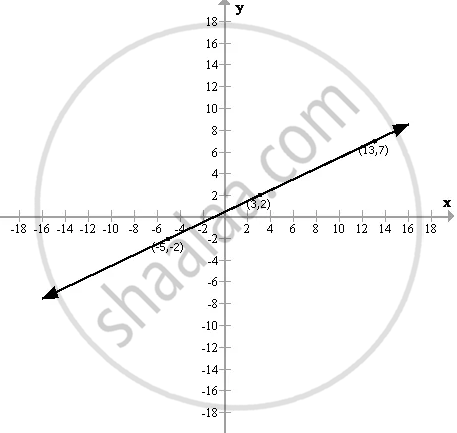
Use the table given below to draw the graph.
| X | - 5 | - 1 | 3 | b | 13 |
| Y | - 2 | a | 2 | 5 | 7 |
From your graph, find the values of 'a' and 'b'.
State a linear relationship between the variables x and y.
Advertisements
उत्तर
The table is:
| X | - 5 | - 1 | 3 | b | 13 |
| Y | - 2 | a | 2 | 5 | 7 |
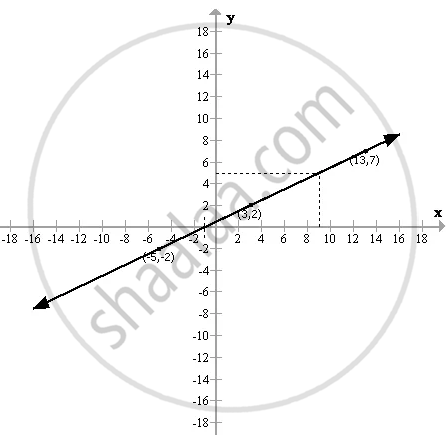
Plotting the points as shown in the above table, we get the following required graph:
When x = - 1, then y = 0
⇒ a = 0
When y = 5, then x = 9
⇒ b = 9
Let y = px + q ....(1)
be a linear relation between x and y
Substitute x = 9 and y = 5 in the equation (1), we have,
5 = 9p + q ....(2)
Substitute x = - 1 and y = 0 in the equation (1), we have,
0 = - p + q ....(3)
Subtracting (3) from (2), we have,
5 = 10p
⇒ p = `(5)/(10)`
⇒ p = `(1)/(2)`
From (3), we have,
p = q
∴ q = `(1)/(2)`
Thus, the linear relation is
y = px + q
⇒ y = `(1)/(2) x+(1)/(2)`
⇒ y = `(x + 1)/(2)`
