Advertisements
Advertisements
प्रश्न
The table given below shows the weekly expenditures on food of some households in a locality
| Weekly expenditure (in Rs) | Number of house holds |
| 100 – 200 | 5 |
| 200- 300 | 6 |
| 300 – 400 | 11 |
| 400 – 500 | 13 |
| 500 – 600 | 5 |
| 600 – 700 | 4 |
| 700 – 800 | 3 |
| 800 – 900 | 2 |
Draw a ‘less than type ogive’ and a ‘more than type ogive’ for this distribution.
Advertisements
उत्तर
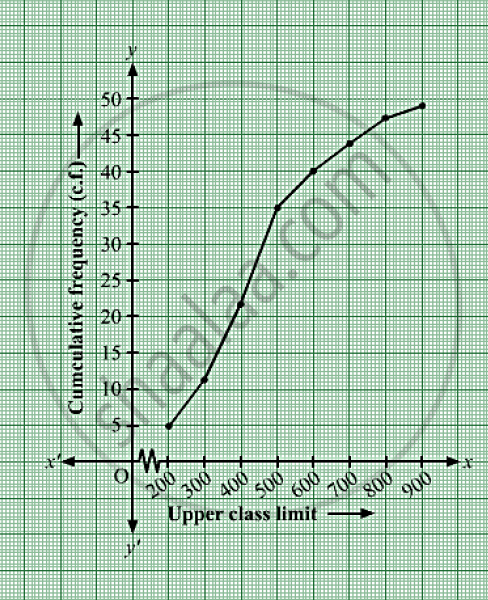
The frequency distribution table of less than type is as follows:
| Weekly expenditure (in Rs) (upper class limits) | Cumulative frequency (cf) |
| Less than 200 | 5 |
| Less than 300 | 5 + 6 = 11 |
| Less than 400 | 11 + 11 = 22 |
| Less than 500 | 22 + 13 = 35 |
| Less than 600 | 35 + 5 = 40 |
| Less than 700 | 40 + 4 = 44 |
| Less than 800 | 44 + 3 = 47 |
| Less than 900 | 47 + 2 = 49 |
Taking the lower class limits on x-axis and their respective cumulative frequencies on y-axis, its ogive can be obtained as follows
Now,
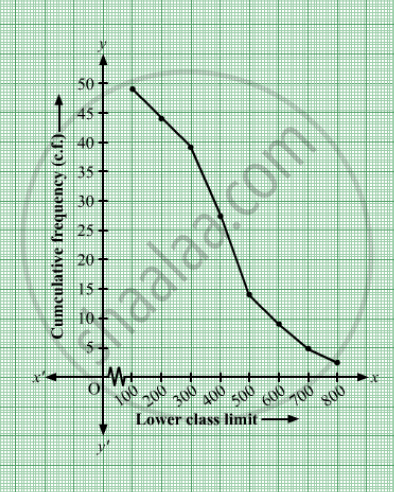
The frequency distribution table of more than type is as follows:
| Weekly expenditure (in Rs) (lower class limits) | Cumulative frequency (cf) |
| More than 100 | 44 + 5 = 49 |
| More than 200 | 38 + 6 = 44 |
| More than 300 | 27 + 11 = 38 |
| More than 400 | 14 + 13 = 27 |
| More than 500 | 9 + 5 = 14 |
| More than 600 | 5 + 4 = 9 |
| More than 700 | 2 + 3 = 5 |
| More than 800 | 2 |
Taking the lower class limits
on x-axis and their respective
cumulative frequencies on y-axis,
its ogive can be obtained as follows:
shaalaa.com
या प्रश्नात किंवा उत्तरात काही त्रुटी आहे का?
