Advertisements
Advertisements
प्रश्न
The table given below shows the GDP growth rate at 2011-12 prices. You have studied about the techniques of presentation of data in your Statistics for Economics course. Draw a time series line graph based on the data given in the table and interpret the same.
| Year | GDP Growth Rate (%) |
| 2012-13 | 5.5 |
| 2013-14 | 6.4 |
| 2014-15 | 7.5 |
| 2015-16 | 8.0 |
| 2016-17 | 8.3 |
| 2017-18 | 6.8 |
| 2018-19 | 6.5 |
| 2019-20 | 3.9 |
| 2020-21 | 5.8 |
| 2021-22 | 9.4 |
आलेख
Advertisements
उत्तर
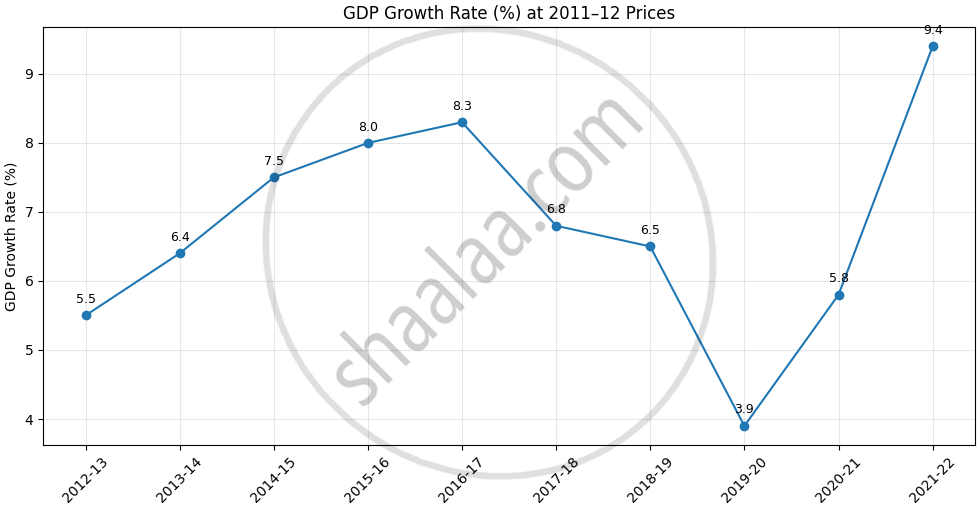
The GDP growth rate increased steadily from 5.5% in 2012-13 to 8.3% in 2016-17. After 2016-17, it began to decline, falling to 3.9% in 2019-20, the lowest rate in the period. Afterwards, GDP growth recovered to 5.8% in 2020-21 and rose sharply to 9.4% in 2021-22, the highest growth rate in the period.
Conclusion: The graph shows that GDP growth fluctuated over the years, with a major decline through 2019-20 followed by a strong recovery in 2021-22.
shaalaa.com
या प्रश्नात किंवा उत्तरात काही त्रुटी आहे का?
