Advertisements
Advertisements
प्रश्न
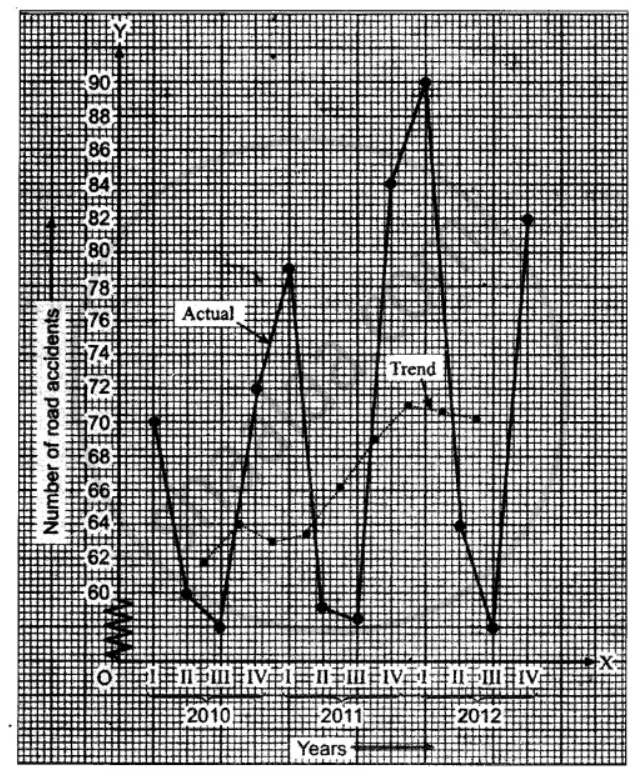
The number of road accidents in the city due to rash driving, over a period of 3 years, is given in the following table:
| Year | Jan-March | April-June | July-Sept. | Oct.-Dec. |
| 2010 | 70 | 60 | 45 | 72 |
| 2011 | 79 | 56 | 46 | 84 |
| 2012 | 90 | 64 | 45 | 82 |
Calculate four quarterly moving averages and illustrate them and original figures on one graph using the same axes for both.
बेरीज
Advertisements
उत्तर
| Year/Quarters | Road Accidents | 4 quarterly moving total | 4 quarterly moving average |
|
`{:(I), (II), (III), (IV):}}2010` |
70 60 45 72 |
247 |
61.75 |
| Year/Quarters | Road Accidents | 4 quarterly moving total | 4 quarterly moving average |
|
`{:(I), (II), (III), (IV):}}2011` |
79 56 46 84 |
252 253 265 276 |
63 |
|
`{:(I), (II), (III), (IV):}}2012` |
90 64 45 82 |
284 283 281 |
71 |
shaalaa.com
या प्रश्नात किंवा उत्तरात काही त्रुटी आहे का?
