Advertisements
Advertisements
प्रश्न
The number of match sticks in 40 boxes, on counting was found as given below:
| 44 | 41 | 42 | 43 | 47 | 50 | 51 | 49 | 43 | 42 |
| 40 | 42 | 44 | 45 | 49 | 42 | 46 | 49 | 45 | 49 |
| 45 | 47 | 48 | 43 | 43 | 44 | 48 | 43 | 46 | 50 |
| 43 | 52 | 46 | 49 | 52 | 51 | 47 | 43 | 43 | 45 |
Taking classes 40 – 41, 42 – 43 etc., construct the frequency distribution table for the above data. Draw a histogram represent the above distribution.
आलेख
Advertisements
उत्तर
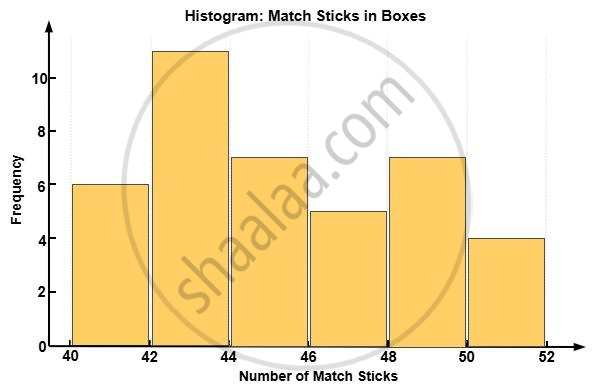
Here is the histogram representing the number of matchsticks in 40 boxes using the class intervals 40 – 41, 42 – 43, etc. The bars show the frequency of boxes falling within each class interval.
shaalaa.com
या प्रश्नात किंवा उत्तरात काही त्रुटी आहे का?
