Advertisements
Advertisements
प्रश्न
The monthly profits (in Rs.) of 100 shops are distributed as follows:
| Profits per shop: | 0 - 50 | 50 - 100 | 100 - 150 | 150 - 200 | 200 - 250 | 250 - 300 |
| No. of shops: | 12 | 18 | 27 | 20 | 17 | 6 |
Draw the frequency polygon for it.
Advertisements
उत्तर
Firstly, we make a cumulative frequency table.
| Profit per shop | No. of shop | More than profit | Cumulative frequency | Suitable points |
| 0-50 | 12 | 0 | 100 | (0, 100) |
| 50-100 | 18 | 50 | 88 | (50, 88) |
| 100-150 | 27 | 100 | 70 | (100, 70) |
| 150-200 | 20 | 150 | 43 | (150, 43) |
| 200-250 | 17 | 200 | 23 | (200, 23) |
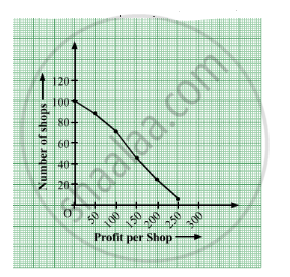
| 250-300 | 6 | 250 | 6 | (250, 6) |
Now, plot the frequency polygon (or more than ogive) using suitable points.
shaalaa.com
या प्रश्नात किंवा उत्तरात काही त्रुटी आहे का?
