Advertisements
Advertisements
प्रश्न
The histogram drawn on the graph represents the number of students of different heights (in cm).
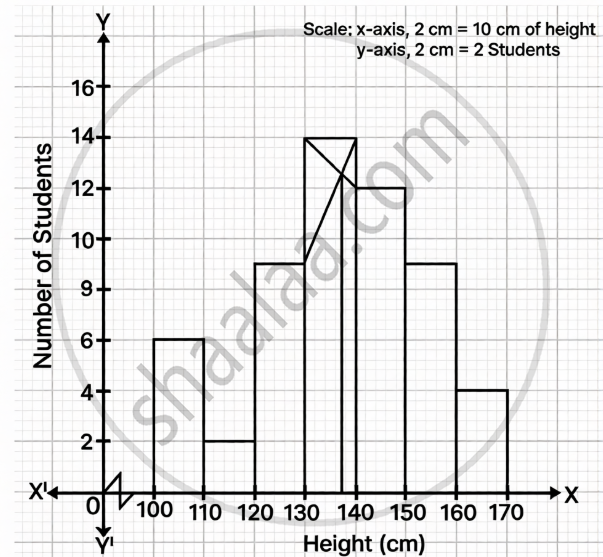
Using the graph, answer the following:
- The number of students whose height is 150 cm and above.
- The modal height.
- The total number of students.
बेरीज
Advertisements
उत्तर
(a) From the graph,
Students whose height = 150 cm
150 − 160 = 9 students
160 − 170 = 4 students
Total number of students whose height is 150 cm and above
= 9 + 4
= 13
Hence, the number of students whose height is 150 cm and above = 13.
(b) From the graph,
The vertical line intersects the x-axis at 137.
Hence, the modal height = 137 cm.
(c) Total number of students = 6 + 2 + 9 + 14 + 12 + 9 + 4
= 56
Hence, the total number of students = 56.
shaalaa.com
या प्रश्नात किंवा उत्तरात काही त्रुटी आहे का?
2025-2026 (March) Official Board Paper
