Advertisements
Advertisements
प्रश्न
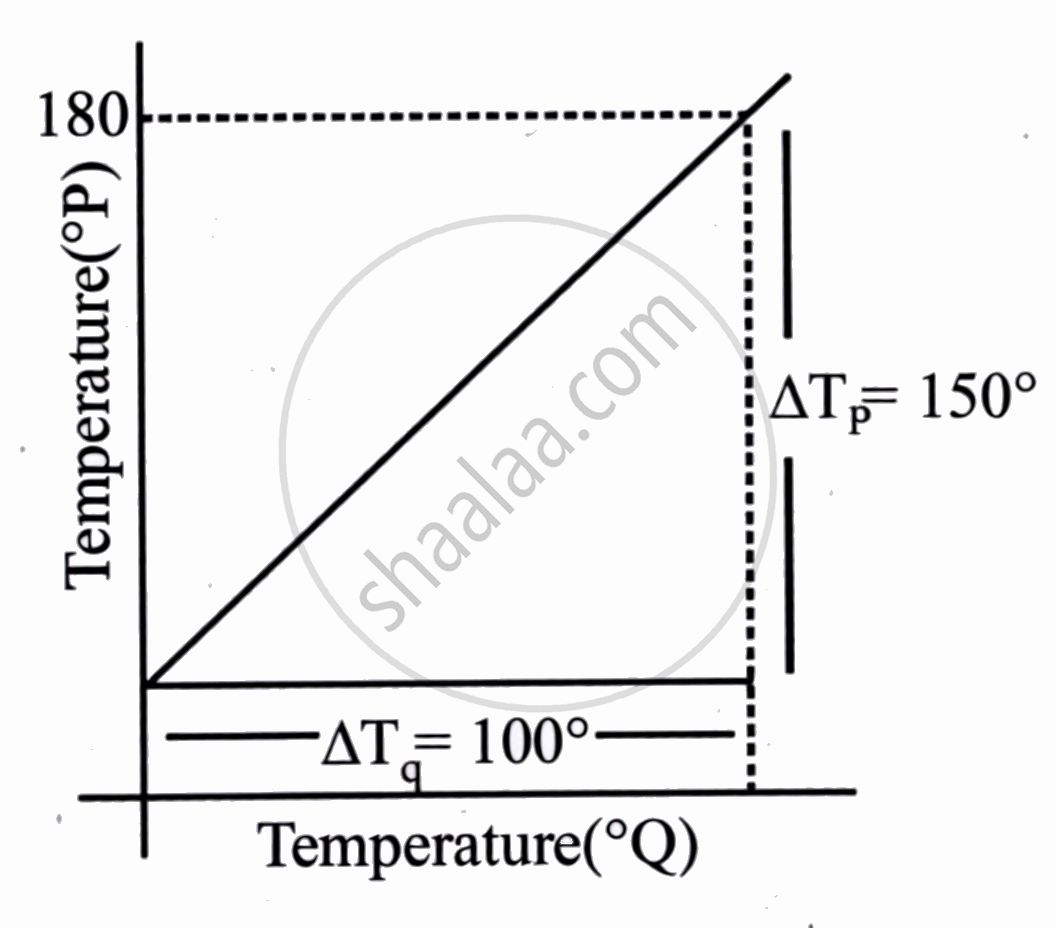
The graph between two temperature scales P and Q is shown in the figure. Between upper fixed point and lower fixed point there are 150 equal divisions of scale P and 100 divisions on scale Q. The relationship for conversion between the two scales is given by:
पर्याय
`(t_Q)/150 = (t_P - 180)/100`
`(t_Q)/100 = (t_P - 30)/150`
`(t_P)/180 = (t_Q - 40)/100`
`(t_P)/100 = (t_Q - 180)/150`
Advertisements
उत्तर
`bb((t_Q)/100 = (t_P - 30)/150)`
Explanation:
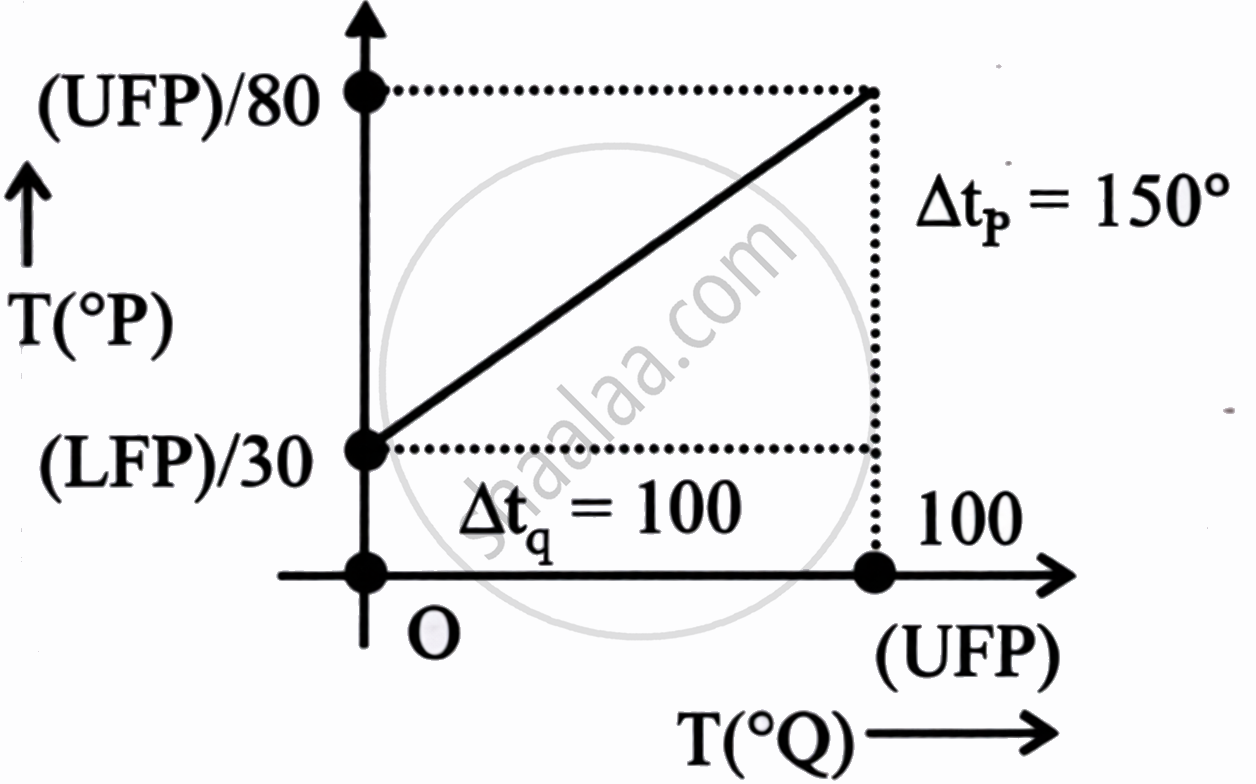
The graph shows that the total change in temperature for Scale P(ΔTP) is 150 units. The upper value on the graph for scale P is 180 P.
LFPP = 180 − 150
= 30° P
The graph shows the line starting from the vertical axis where tQ = 0. The total change for Scale Q(ΔTQ) is 100 units.
LFPQ = 0° Q
The general relationship for any temperature scale is:
`"Temperature - Lower Fixed Point (LFP)"/"Number of Divisions"` = Constant
The conversion formula for both scales:
`(t_p - LFP_P)/("Division"_P) = (t_Q - LFP_Q)/("Division"_Q)`
`(t_P - 30)/150 = (t_Q - 0)/100`
`(t_Q)/100 = (t_P - 30)/150`
