Advertisements
Advertisements
प्रश्न
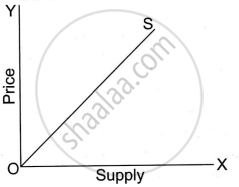
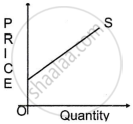
The given diagram is a case of ______ supply.

पर्याय
Less Elastic Supply
Highly Elastic Supply
Unitary Elastic Supply
Perfectly Elastic Supply
Advertisements
उत्तर
The given diagram is a case of Highly elastic supply.
APPEARS IN
संबंधित प्रश्न
Explain briefly the impact of the cost of production on the elasticity of supply.
Identify the degree of elasticity of supply from the following graph:
Explain any three factors affecting elasticity of supply.
Identify the elasticity of supply for the following with proper reasoning:
Short run and long run period.
A 10 per cent increase in price of a good causes 5 per cent increase in its quantity supplied, elasticity of supply will be ______.
When price of a·product rises by 10% its quantity supplied also rises by 10%. Find out price elasticity.
Which of the following statements are true?
The cost of production will increase if
- The government gives subsidies
- The firm uses obsolete technology
- The price of diesel increases
If the price elsaticity of supply is 1 and the percentage change in price is 10, then the percentage change in quatity supplied should be ______.
Define elasticity of supply.
Which of the following measures of price elasticity shows inelastic supply?
When is the supply of a commodity is called elastic?
The quantity of a commodity supplied increases by 25% when its price rises by 10%. Calculate price elasticity of supply.
The price of a commodity rises from ₹ 20 to ₹ 40 Consequently, its supply increases from 100 units to 400 units. Calculate price elasticity of supply.
Explain any four determinants of elasticity of supply.
Give the meaning of perfectly elastic supply.
Draw the supply curve showing price elasticity of supply greater than one.
Indicate the degree of elasticity on the supply curve given below:
What do you mean by elastic supply?
Draw a straight line supply curve of the following situation.
More than unitary elastic
