Advertisements
Advertisements
प्रश्न
The given bar chart shows the details of cycle sales by a company between January and May for years 2017 and 2018.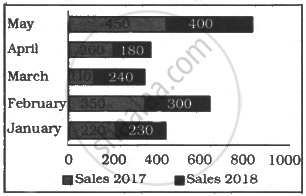
In the given bar chart, which month's sale shows the maximum decrease in 2018 as compared to 2017?
पर्याय
May
February
April
January
MCQ
Advertisements
उत्तर
February
Explanation:
In the given bar chart the sales of February shows the maximum decrease 350 `→` 300 i.e. = 17% decrease in 2018 as compared to 2017.
Note: that in April sales decrease % is 10% only (200 - 180) and in May sales decrease % is 12.5 % only 450 - 400.
shaalaa.com
Data Interpretation (Entrance Exam)
या प्रश्नात किंवा उत्तरात काही त्रुटी आहे का?
