Advertisements
Advertisements
प्रश्न
The following pictograph shows the number of watches manufactured by a factory, in a particular weeks.
| Day | Number of watches |
| Monday |       |
| Tuesday |            |
| Wednesday |       |
| Thursday |       |
| Friday |      |
| Saturday |         |
Scale:  = 100 watches
Find on which day was the least number of watches manufactured?
Advertisements
उत्तर
On Friday least no. of watches manufactured by
= 100 x 5 = 500 watches
APPEARS IN
संबंधित प्रश्न
The sale of vehicles, in a particular city, during the first six months of the year 2016 is shown below:
| Month | Jan | Feb | March | April | May | June |
| Number of vehicles sold | 3000 | 2500 | 4000 | 1000 | 1500 | 3500 |
Draw a pictograph to represent the above data.
The following pictograph shows the number of watches manufactured by a factory, in a particular weeks.
| Day | Number of watches |
| Monday | |
| Tuesday | |
| Wednesday | |
| Thursday | |
| Friday | |
| Saturday | |
Scale: = 100 watches
Find the total number of watches manufactured in the whole week?
Representation of data by using pictures is known as ______________
The following table shows the weight of paddy cultivated in a particular village during the years 2010 to 2015
| Year | Paddy production |
| 2010 |  |
| 2011 |  |
| 2012 |  |
| 2013 |  |
| 2014 |  |
| 2015 |  |

Observe the pictograph and answer the following questions.
a) In which year paddy production was maximum?
b) In which year paddy production were equal?
c) Find the quantity of paddy production in 2015
d) Find the total quantity of paddy production particularly 2013, 2014, and 2015
The total number of pupil studying in 5 school in a particular are as follows
GHSS: 1000
PUPS: 200
BHSS: 400
PUM5: 400
Private nursery School: 800
Prepare a pictograph using the symbol  to represent 100 Pupil and answer the following question:
1. Which school has the maximum number of pupil?
2. Which school has the least number of pupil?
Mr. Dinesh collected the information about the rainfall of a particular city in a week from the newspaper and recorded his information in the pictograph.
| Millimeters of Rain | |
| Sunday |  |
| Monday |  |
| Tuesday |  |
| Wednesday |  |
| Thursday |  |
| Friday |  |
| Saturday |  |
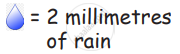
a. On which day, the rain was most?
b. On which day, the rain was least?
c. How much rain was there on Sunday?
d. How much rain was there on Monday?
e. Find total rainfall of the city in that week?
The number of bottles of cold drinks sold by a shopkeeper on six consecutive days is as follows:
| Day | Sunday | Monday | Tuesday | Wednesday | Thursday | Friday |
| Number of bottles | 350 | 200 | 300 | 250 | 100 | 150 |
Prepare a pictograph of the data using one symbol to represent 50 bottles.
The following table gives information about the circulation of newspapers (dailies) in a town in five languages.
| Language | English | Hindi | Tamil | Punjabi | Gujarati |
| Number of newspapers |
5000 | 8500 | 500 | 2500 | 1000 |
Prepare a pictograph of the above data, using a symbol of your choice, each representing 1000 newspapers.
Annual expenditure of a company in the year 2007-2008 is given below:
| Items | Expenditure (Rs in lakh) |
| Salaries of employees | 65 |
| Advertisement | 10 |
| Purchase of machinery | 85 |
| Electricity and water | 15 |
| Transportation | 25 |
| Other expenses | 30 |
Prepare a pictograph of the above data using an appropriate symbol to represent Rs 10 lakh.
In preparing a pictograph for the data: Farming (60), Private Job (20), Government Job (30), and Other (40), which scale would be most efficient?
