Advertisements
Advertisements
प्रश्न
The following distribution gives the daily income of 50 workers of a factory.
| Daily income (in ₹) | 200-220 | 220-240 | 240-260 | 260-280 | 280-300 |
| Number of workers | 12 | 14 | 8 | 6 | 10 |
Convert the distribution above to a 'less than type' cumulative frequency distribution and draw its ogive.
बेरीज
Advertisements
उत्तर
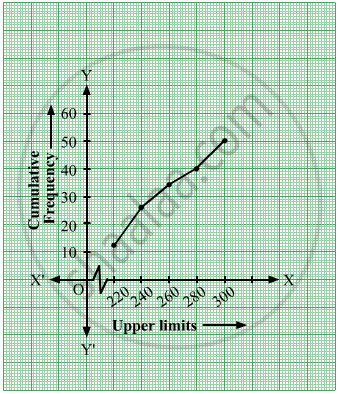
The less than type cumulative frequency distribution table will be as follows:
| Daily income(in ₹) | Number of Workers | Daily Income Less than | Cumulative Frequency |
| 200 - 220 | 12 | 220 | 12 |
| 220 - 240 | 14 | 240 | 12 + 14 = 26 |
| 240 - 260 | 8 | 260 | 26 + 8 = 34 |
| 260 - 280 | 6 | 280 | 34 + 6 = 40 |
| 280 - 300 | 10 | 300 | 40 + 10 = 50 |
The ogive thus formed will be
shaalaa.com
Graphs of Linear Equations
या प्रश्नात किंवा उत्तरात काही त्रुटी आहे का?
