Advertisements
Advertisements
प्रश्न
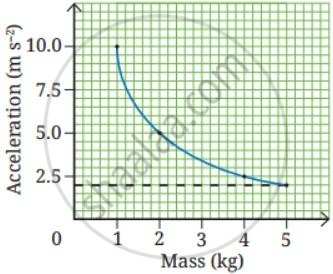
The acceleration-mass graph for the acceleration produced by a force on objects of different masses is plotted in the Fig. Plot the force-mass graph for this case.
आलेख
संख्यात्मक
सविस्तर उत्तर
Advertisements
उत्तर
Reading the results from the acceleration-mass graph (Fig.):
| Mass (kg) | Acceleration (m s–2) | Force (F = ma) in N |
| 1 | 10.0 | 1 × 10.0 = 10 |
| 2 | 5.0 | 2 × 5.0 = 10 |
| 3 | 2.5 | 4 × 2.5 = 10 |
| 4 | 2.0 | 5 × 2.0 = 10 |
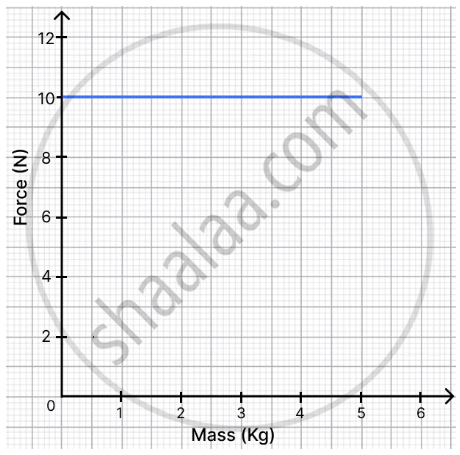
We know that Force = mass × acceleration (F = ma).
When the force is calculated for different masses, it is found to be the same value, 10 N, in each case. This is because the same force has been applied to objects with different masses.
Therefore, the force–mass graph is a straight line parallel to the mass axis at F = 10 N, as shown below.
shaalaa.com
या प्रश्नात किंवा उत्तरात काही त्रुटी आहे का?
