Advertisements
Advertisements
प्रश्न
State the behaviour of marginal product in the law of variable proportions. Explain the causes of this behaviour
Explain the Law of Variables Proportions with the help of total product and marginal product curves.
What does the Law of Variable Proportions show? State the behaviour of the total product
according to this law
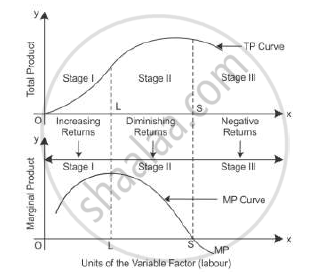
State different phases of the law of variable proportions on the basis of total product. Use Diagram.
What are the different phases of the Law of Variable Proportions in terms of marginal product? Give reason behind each phase. Use diagram
Advertisements
उत्तर
Law of variable proportion:-
Law of variable proportion states that as more of the variable factor input is combined with the fixed factor input, a point will eventually be reached where the marginal product of the variable factor input starts declining
| Units of Fixed Factor |
Units of Variable Factor |
TP | MP | Stages |
| 1 | 1 | 4 | 4 | Increasing MP (Increasing returns to a factor) |
| 1 | 2 | 12 | 8 | |
| 1 | 3 | 24 | 12 | |
| 1 | 4 | 32 | 8 |
Diminishing MP (Diminishing |
| 1 | 5 | 34 | 2 | |
| 1 | 6 | 34 | 0 | |
| 1 | 7 | 30 | -4 |
Negative MP (Negative returns |
| 1 | 8 | 21 | -9 | |
| 1 | 9 | 10 | -11 |
Let us consider the above table.
Stage I: As more units of factor input are used, MP tends to rise till 3 units of factor input are used. Here, the total product increases at an increasing rate which is called increasing returns to the factor input.
Stage II: However, when the 4th unit of factor input is used, the diminishing returns sets in, where MP starts decreasing and TP increases at a decreasing rate. Diminishing MP reduces to zero. The total output is the maximum when the marginal output is zero.
Stage III: When MP is negative, TP starts declining from 34 to 10 when the 9th unit is employed.
APPEARS IN
संबंधित प्रश्न
State the different phases of change in the total product according to the Law of Variable Proportions. Use diagram
What are the different phases in the Law of Variable Proportions in terms of Total Product ? Give reasons behind each phase. Use diagram.
What is the law of variable proportions?
Explain the law of variable proportions with the help of a diagram.
Who said, that one of the key of an entrepreneur is “uncertainty bearing”.
Mention the economies reaped from inside the firm
Product obtained from additional factors of production is termed as
Modern economists have propounded the law of
Define Marginal Product of a factor.
Why is the AVC curve U-shaped?
At the point of inflexion, ______ is maximum.
What are Average product?
What is marginal product?
With the help of a suitable diagram, discuss the relationship between Average product and Marginal Product.
Which term describes the extra output from adding one more unit of labour in production?
What happens to marginal product after a certain point, if more and more labour is added to fixed land?
Which stage is shown when total production drops and marginal product becomes negative?
