Advertisements
Advertisements
प्रश्न
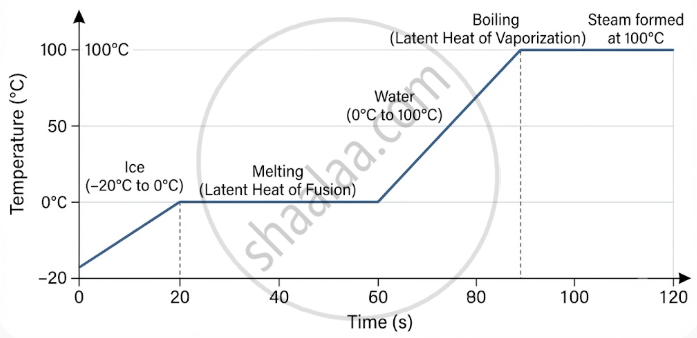
Some ice is heated at a constant rate, and its temperature is recorded after every few seconds, till steam is formed at 100°C. Draw a temperature-time graph to represent the change. Label the two-phase changes in your graph.
आलेख
Advertisements
उत्तर
shaalaa.com
या प्रश्नात किंवा उत्तरात काही त्रुटी आहे का?
पाठ 5: Heat - Frequently Asked Questions in Board Examination [पृष्ठ ३३६]
