Advertisements
Advertisements
प्रश्न
Solve the given inequality graphically in two-dimensional plane: y < –2
Advertisements
उत्तर
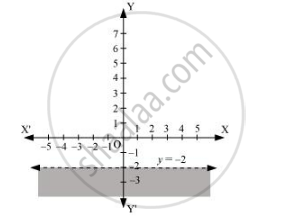
The graphical representation of y = –2 is given as dotted line in the figure below. This line divides the xy-plane in two half planes.
Select a point (not on the line), which lies in one of the half planes, to determine whether the point satisfies the given inequality or not.
We select the point as (0, 0).
It is observed that,
0 < –2, which is false
Also, it is evident that any point on the line does not satisfy the given inequality.
Hence, every point below the line, y = –2 (excluding all the points on the line), determines the solution of the given inequality.
The solution region is represented by the shaded region as follows.
संबंधित प्रश्न
Solve the given inequality graphically in two-dimensional plane: x + y < 5
Solve the given inequality graphically in two-dimensional plane: 2x + y ≥ 6
Solve the given inequality graphically in two-dimensional plane: 3x + 4y ≤ 12
Solve the given inequality graphically in two-dimensional plane: 2x – 3y > 6
Solve the given inequality graphically in two-dimensional plane: –3x + 2y ≥ –6
Solve the given inequality graphically in two-dimensional plane: 3y – 5x < 30
Solve the given inequality graphically in two-dimensional plane: x > –3
Solve the inequalities and represent the solution graphically on number line:
5x + 1 > –24, 5x – 1 < 24
Solve the inequality and represent the solution graphically on number line:
2(x – 1) < x + 5, 3(x + 2) > 2 – x
Solve the following inequalities and represent the solution graphically on number line:
3x – 7 > 2(x – 6), 6 – x > 11 – 2x
A solution is to be kept between 68° F and 77° F. What is the range in temperature in degree Celsius (C) if the Celsius/Fahrenheit (F) conversion formula is given by `F= 9/8` C + 32?
How many litres of water will have to be added to 1125 litres of the 45% solution of acid so that the resulting mixture will contain more than 25% but less than 30% acid content?
Solve the following systems of linear inequation graphically:
2x + 3y ≤ 6, 3x + 2y ≤ 6, x ≥ 0, y ≥ 0
Solve the following systems of linear inequation graphically:
2x + 3y ≤ 6, x + 4y ≤ 4, x ≥ 0, y ≥ 0
Solve the following systems of linear inequations graphically:
x − y ≤ 1, x + 2y ≤ 8, 2x + y ≥ 2, x ≥ 0, y ≥ 0
Show that the solution set of the following linear inequations is empty set:
x − 2y ≥ 0, 2x − y ≤ −2, x ≥ 0, y ≥ 0
Find the linear inequations for which the shaded area in Fig. 15.41 is the solution set. Draw the diagram of the solution set of the linear inequations:
Show that the solution set of the following linear in equations is an unbounded set:
x + y ≥ 9
3x + y ≥ 12
x ≥ 0, y ≥ 0
Solve the following systems of inequations graphically:
2x + y ≥ 8, x + 2y ≥ 8, x + y ≤ 6
Solve the following systems of inequations graphically:
12x + 12y ≤ 840, 3x + 6y ≤ 300, 8x + 4y ≤ 480, x ≥ 0, y ≥ 0
Solve the following systems of inequations graphically:
x + 2y ≤ 40, 3x + y ≥ 30, 4x + 3y ≥ 60, x ≥ 0, y ≥ 0
Show that the following system of linear equations has no solution:
\[x + 2y \leq 3, 3x + 4y \geq 12, x \geq 0, y \geq 1\]
Mark the correct alternative in each of the following:
If x\[<\]7, then
Write the solution of the inequation\[\frac{x^2}{x - 2} > 0\]
State which of the following statement is True or False.
If xy > 0, then x < 0 and y < 0
Graph of x < 3 is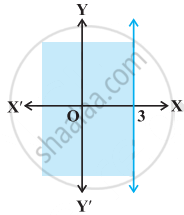
Graph of x ≥ 0 is