Advertisements
Advertisements
प्रश्न
Schematically represent the temperature-composition curve for the vapour in equilibrium with an ideal mixture of two completely miscible liquids of different boiling points. Explain with the aid of this diagram how fractional distillation is done.
Advertisements
उत्तर
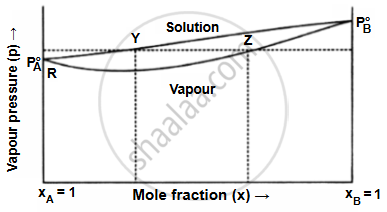
Two completely miscible liquids with varying vapour pressures are A and B. The graph indicates that the solution curve is higher than the vapour composition curve. The more volatile component is always abundant in the vapour. Points Y and Z provide the composition of the solution and the vapour, respectively, at a specific vapour pressure denoted by point X. The amount of liquid B, which is more volatile, in the vapours is more than that of liquid A, which is less volatile. Liquids A and B are fractionally distilled based on this information.
