Advertisements
Advertisements
प्रश्न
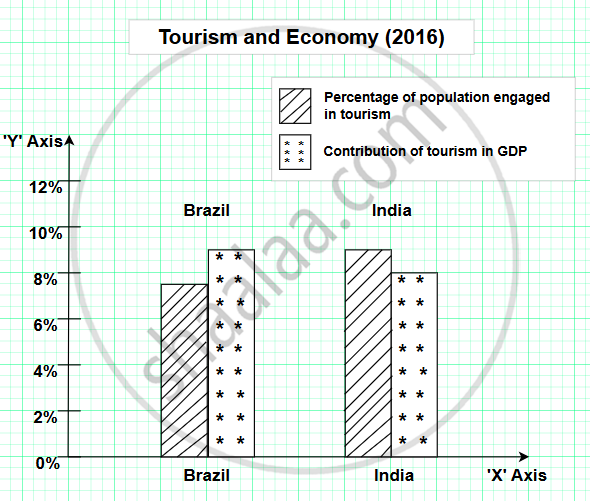
Read the graph and answer the following questions:
Questions:
- What type of graph is shown here?
- What does the graph show?
- Which country’s tourism has a large share in the contribution towards GDP?
- How much percentage of population in India is engaged in tourism?
- How much difference do you find in the population engaged in tourism in both the countries?
- Which country has a large population engaged in tourism sector but contributes less in GDP?
लघु उत्तर
Advertisements
उत्तर
- The graph shown is a bar graph.
- The graph shows tourism and economy (2016), specifically, the percentage of the population engaged in tourism Contribution of tourism to GDP for Brazil and India
- Brazil has a larger share of tourism contribution towards GDP.
- About 9% of the population in India is engaged in tourism.
- The difference in population engaged in tourism between the two countries is about 1%.
- India has a larger population engaged in tourism, but it contributes less to GDP.
shaalaa.com
या प्रश्नात किंवा उत्तरात काही त्रुटी आहे का?
2025-2026 (March) Official Board Paper
