Advertisements
Advertisements
प्रश्न
Prepare pie charts on the occupational structure of the Indian economy available in the following table. Discuss the possible reasons for the change in the shape of pies.
| Sector | 1950-51 | 1990-91 |
| Agriculture | 72.1 | 66.8 |
| Industry | 10.7 | 12.7 |
| Services | 17.2 | 20.5 |
तक्ता
दीर्घउत्तर
Advertisements
उत्तर
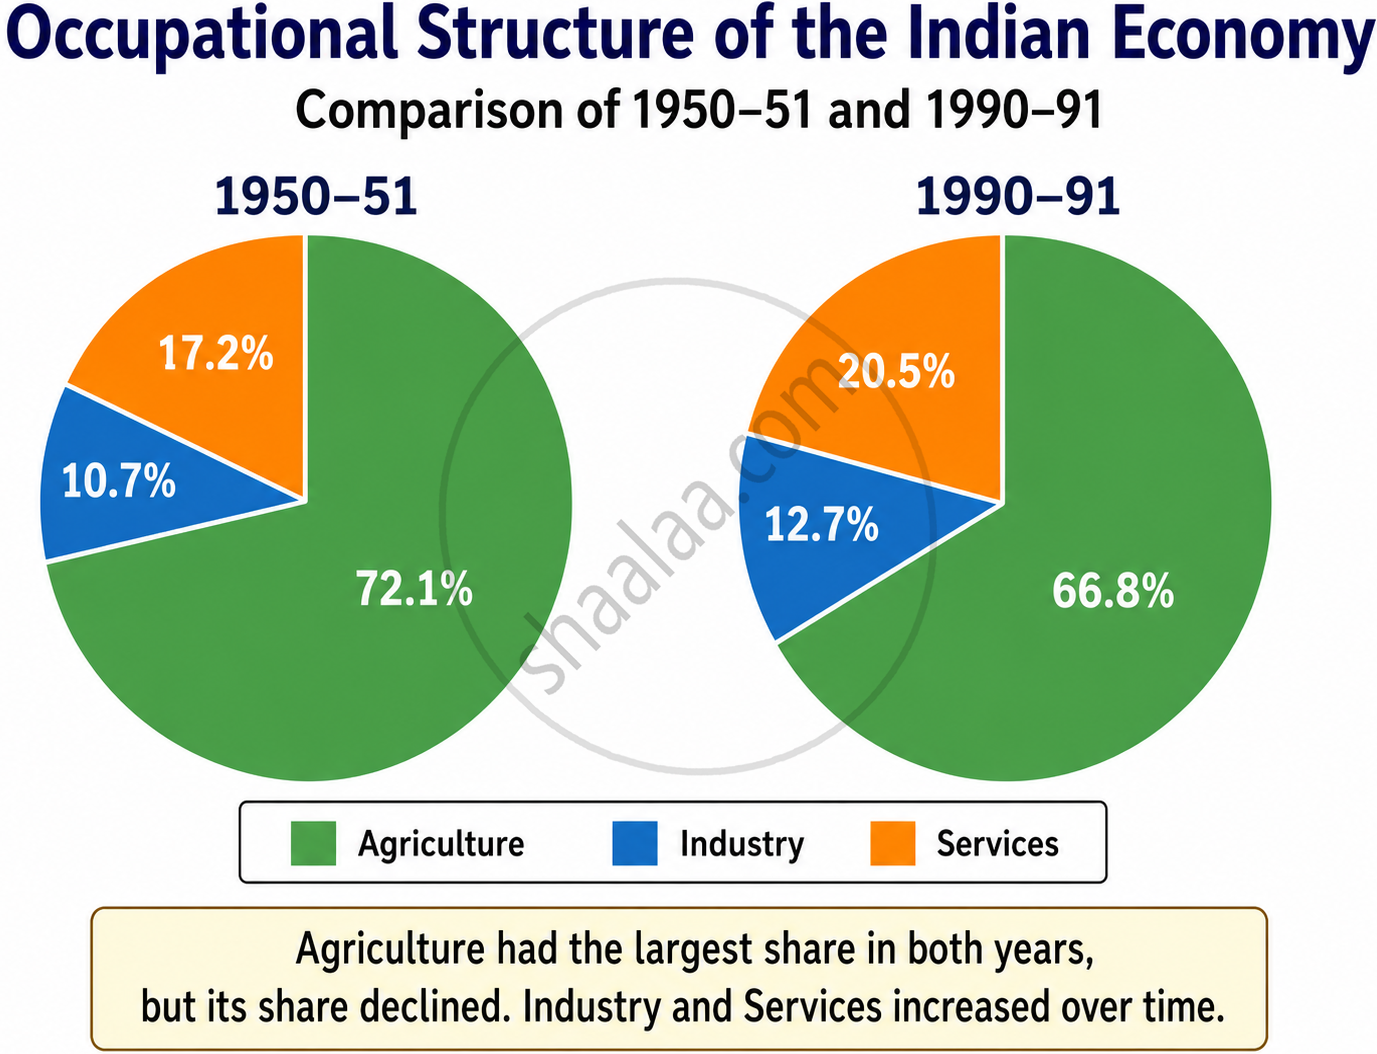
Reasons for the Changes:
- The share of people working in agriculture decreased from 72.1% to 66.8%.
- Employment in industry increased because factories grew and industrial development expanded.
- The service sector also expanded due to growth in education, banking, transport, communication, healthcare, and government services.
- Urbanisation and better education encouraged some people to move from agriculture to industry and services.
- Agriculture still employed the largest share of workers in 1990-91.
Hence, between 1950-51 and 1990-91, India’s occupational structure slowly shifted from agriculture to industry and services, although agriculture remained the main source of employment.
shaalaa.com
या प्रश्नात किंवा उत्तरात काही त्रुटी आहे का?
