Advertisements
Advertisements
प्रश्न
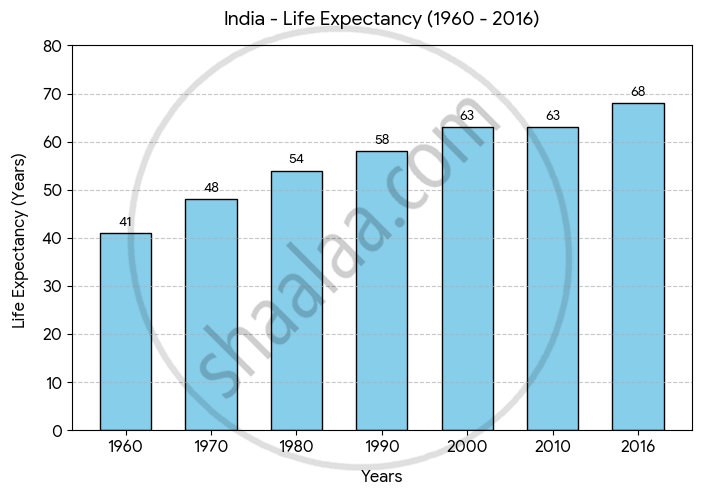
Prepare a simple bar graph with the help of given statistical information and answer the questions given below-
India-life expectancy
| Years | Life expectancy |
| 1960 | 41 |
| 1970 | 48 |
| 1980 | 54 |
| 1990 | 58 |
| 2000 | 63 |
| 2010 | 63 |
| 2016 | 68 |
आलेख
Advertisements
उत्तर
shaalaa.com
Notes
Incomplete question given in the question bank
या प्रश्नात किंवा उत्तरात काही त्रुटी आहे का?
