Advertisements
Advertisements
प्रश्न
Prepare a Pie chart and a column chart for the 10 different plot areas: 5, 7, 8, 9, 8, 10, 4, 6, 7 and 3 hectares, respectively.
Advertisements
उत्तर
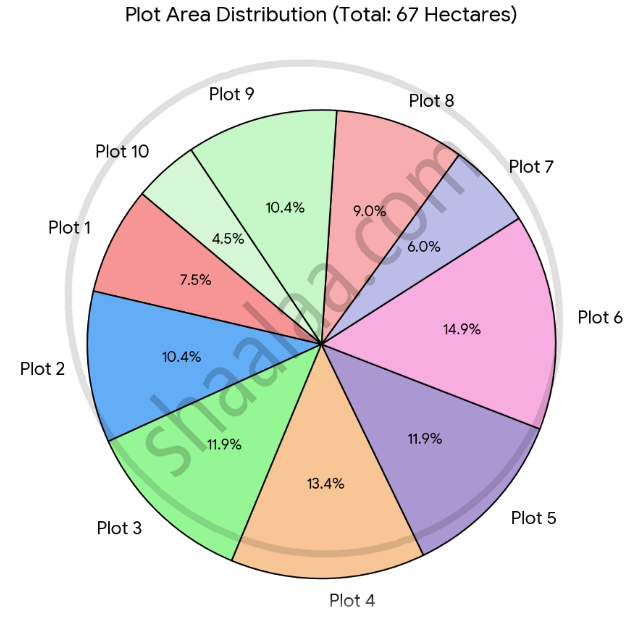
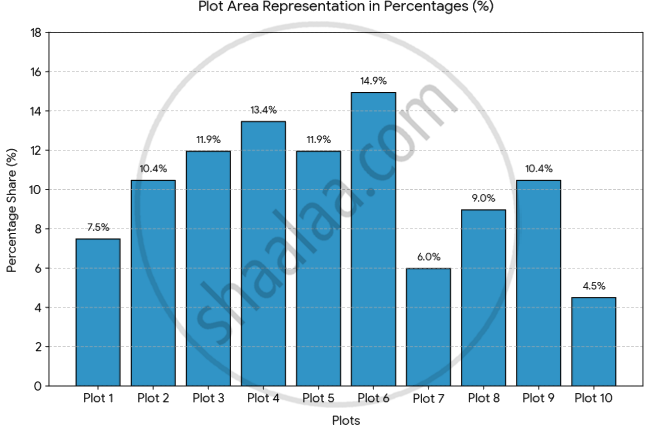
Total Area = 5 + 7 + 8 + 9 + 8 + 10 + 4 + 6 + 7 + 3
= 67 Hectares
Percentage (%) = `"Plot Area"/"Total Area" xx 100`
Plot 1 (5 Hectares):
Percentage (%) = `(5/67) xx 100`
= 7.4626%
= 7.5%
Plot 2 (7 Hectares):
Percentage (%) = `(7/67) xx 100`
= 10.4447%
= 10.4%
Plot 3 (8 Hectares):
Percentage (%) = `(8/67) xx 100`
= 11.940%
= 11.9%
Plot 4 (9 Hectares):
Percentage (%) = `(9/67) xx 100`
= 13.432%
= 13.4%
Plot 5 (8 Hectares):
Percentage (%) = `(8/67) xx 100`
= 11.940%
= 11.9%
Plot 6 (10 Hectares):
Percentage (%) = `(10/67) xx 100`
= 14.925%
= 14.9%
Plot 7 (4 Hectares):
Percentage (%) = `(4/67) xx 100`
= 5.970%
= 6.0%
Plot 8 (6 Hectares):
Percentage (%) = `(6/67) xx 100`
= 8.955%
= 9.0%
Plot 9 (7 Hectares):
Percentage (%) = `(7/67) xx 100`
= 10.447%
= 10.4%
Plot 10 (3 Hectares):
Percentage (%) = `(3/67) xx 100`
= 4.477%
= 4.5%
