Advertisements
Advertisements
प्रश्न
Monthly expenditure of Kumaran’s family is given below. Draw a suitable Pie chart.
| Particulars | Food | Education | Rent | Transport | Miscellaneous |
| Expenses (in %) | 50% | 20% | 15% | 5% | 10% |
Also
1. Find the amount spent for education if Kumaran spends ₹ 6000 for Rent.
2. What is the total salary of Kumaran?
3. How much did he spend more for food than education?
आकृती
बेरीज
Advertisements
उत्तर
| Particulars | Expeenses (in %) |
Central angle |
| Food | 50% | `50/100 xx 360^circ` = 180° |
| Education | 20% | `20/100 xx 360^circ` = 72° |
| Rent | 15% | `15/100 xx 360^circ` = 54° |
| Transport | 5% | `5/100 xx 360^circ` = 18° |
| Miscellaneous | 10% | `10/100 xx 360^circ` = 36° |
| Total | 100% | 360° |
Monthly expenditure of kumaran’s family.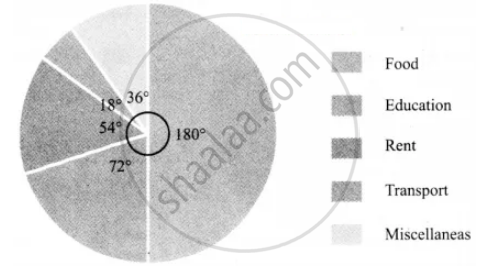
1. Given Kumaran spends ₹ 6000 for Rent.
∴ 15% of total expenditure = 6000
`15/100` (Total Expenditure) = 6000
Total Expenditure = `(6000 xx 100)/15`
Total Expenditure = ₹ 40,000
Amount spend for education = 20% of total expenditure.
`20/100 xx 40000`
= ₹ 8000
2. Total salary of Kumaran = ₹ 40,000
3. Amount spend for food = 50% of 40,000
Amount spend for the food than education
= 20,000 – 8,000
= ₹ 12,000
shaalaa.com
या प्रश्नात किंवा उत्तरात काही त्रुटी आहे का?
