Advertisements
Advertisements
प्रश्न
Look at the table given, which shows the growth of the share of the urban population in the total population of Brazil. Draw a line graph from this table. Examine the graph carefully and answer the following questions.
Brazil percentage of urban population (1960 to 2010)
| 1960 | 1970 | 1980 | 1990 | 2000 | 2010 |
| 47.1 | 56.8 | 66 | 74.6 | 81.5 | 84.6 |
- What is the interval of the data?
- In which period did urbanisation occur rapidly?
- Write five sentences analysing the graph.
Advertisements
उत्तर
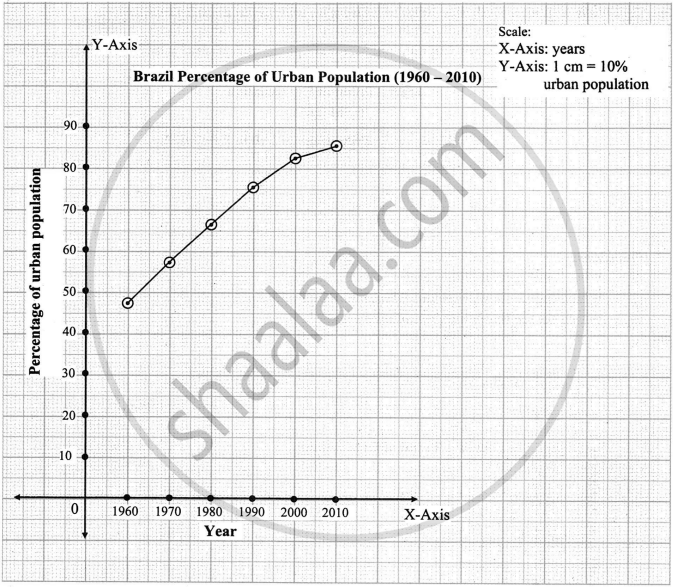
- The interval of data is 10 years.
- Urbanization occurred rapidly in the decade 1960 to 1970.
- The graph can be analysed as follows:
- The graph shows the percentage of urbanisation in Brazil from 1960 to 2010.
- In 1960, the level of urbanisation was 47.1%. During the next decade, by 1970, it increased by 9.7% and reached 56.8%.
- Urbanisation continued to increase after 1980, although the rate of growth became slower.
- Between 2000 and 2010, urbanisation in Brazil rose from 81.5% to 84.6%. However, the increase was only 3.1%.
- The graph clearly indicates that Brazil has experienced rapid urbanisation.
संबंधित प्रश्न
The rate of urbanization in Brazil has reduced after the ______ decade.
Which State has the least urbanization in Brazil?
Distinguish between-
Urbanisation in India and Brazil.
Write answer in one sentence-
Which is the most urbanised state in Brazil?
Prepare a simple bar graph with the help of given statistical information and answer the questions given below-
Brazil-% of urban population
| Year | % of urban population |
| 1960 | 47.1 |
| 1970 | 56.8 |
| 1980 | 66.0 |
| 1990 | 74.6 |
| 2000 | 81.5 |
| 2010 | 84.6 |
Questions-
- What is the interval of years in the data?
- During which year did rapid urbanization start?
- Write five sentences about the analysis of graph.
With the help of given statistical data Prepare a simple bar graph and answer the following questions :
Percentage of Urban Population-Brazil
(1960 to 2010)
| Years | % of urban population |
| 1960 | 47.1 |
| 1970 | 56.8 |
| 1980 | 66.0 |
| 1990 | 74.6 |
| 2000 | 81.5 |
| 2010 | 84.6 |
Questions-
- What does the above line graph show?
- In which decade urbanisation occurred slowly ?
- What was the percentage of increase in urbanisation during the period from 1980 to 1990 ?
State whether the sentence is right or wrong. Correct the wrong ones and rewrite the sentence.
Urbanisation has occurred more in the coastal states than the states in the interior of Brazil.
______ port is located on the confluence of the Negro and the Amazon.
What is the state of urbanisation in Brazil, and why is it concentrated near coastal areas?
Study the choropleth map of Brazil showing the Statewise urban population of Brazil and answer the following questions.

- Which States (region) are the most urbanised?
- Which States (region) are the least urbanised?
