Advertisements
Advertisements
प्रश्न
India is known as the land of the endless growing Season. Explain.
Advertisements
उत्तर
India is known as the land of the endless growing Season because being a sub-tropical land it enjoys a growing Season throughout the year. Growing Season is that part of the year when the growth of vegetation is made possible by the favourable combination of temperature and rainfall.
APPEARS IN
संबंधित प्रश्न
Give a geographical reason for each of the following:
The city of Kanpur in Uttar Pradesh has a higher range of temperature than that of Chennai in Tamil Nadu.
Study the climate data given below and answer the questions that follow:
| Month | Jan | Feb | Mar | Apr | May | June | July | Aug | Sep | Oct | Nov | Dec |
| Temperature in °C |
21.0 | 21.9 | 24.3 | 27.1 | 28.0 | 26.4 | 26.1 | 25.4 | 25.0 | 28.0 | 26.0 | 21.2 |
| Rainfall cm | 5.1 | 2.8 | 1.2 | 1.7 | 3.9 | 4.6 | 8.4 | 11.4 | 11.9 | 31.6 | 34.5 | 14.8 |
- Identify the hottest month.
- Calculate the annual rainfall.
- Name the winds that bring the maximum rainfall to this city.
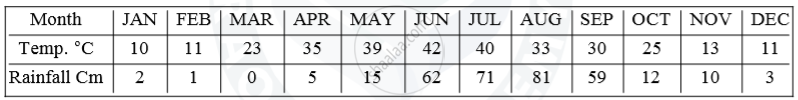
Study the data of distribution of temperature and rain for Station X and answer the questions that follow :
(i) Is Station X in the coastal area or in the interior of the country?
(ii) Calculate the total annual rainfall for Station X.
(iii) Name the wind that brings most of the rainfall to Station X.
Give an account of weather conditions and characteristics of the cold season.
Why are Himalayas called perfect climate divide? Explain their two-fold functions in this regard.
Patna receives heavier rain than Delhi.
Rajasthan receives very little rainfall.
Name the winds which are responsible for heavy rainfall in India.
Name the winds which provide relief rainfall to the Tamil Nadu coast?
Write a note on the uneven distribution of rainfall in India.
