Advertisements
Advertisements
प्रश्न
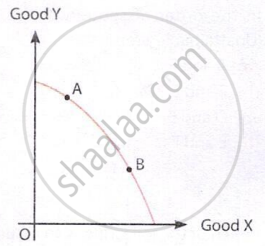
In the given figure, the movement on the production possibility curve from point A to point B shows ______.
(Choose the correct alternative)
पर्याय
Growth of all the resources in the economy
Underutilisation of resources
Production of more units of Good X and less units of Good Y
Production of more units of Good Y and less units of Good X
MCQ
रिकाम्या जागा भरा
Advertisements
उत्तर
In the given figure, the movement on the production possibility curve from point A to point B shows production of more units of Good X and less units of Good Y.
Explanation:
A movement along the PPF from A to B means resources are shifted from Good Y to Good X, so more of Good X and less of Good Y is produced.
shaalaa.com
या प्रश्नात किंवा उत्तरात काही त्रुटी आहे का?
