Advertisements
Advertisements
प्रश्न
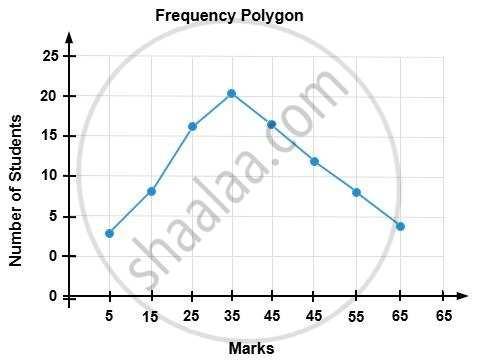
In a class of 60 boys, the marks obtained in a monthly test were as under:
| Marks | 10 – 20 | 20 – 30 | 30 – 40 | 40 – 50 | 50 – 60 |
| Students | 10 | 25 | 12 | 08 | 05 |
Draw a frequency polygon to represent the above data.
आलेख
Advertisements
उत्तर
shaalaa.com
या प्रश्नात किंवा उत्तरात काही त्रुटी आहे का?
