Advertisements
Advertisements
प्रश्न
Graph of y ≤ 0 is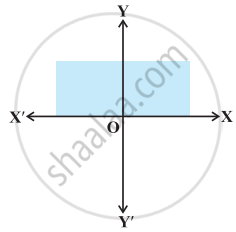
पर्याय
True
False
Advertisements
उत्तर
This statement is False.
Explanation:
The given graph represents y ≥ 0
APPEARS IN
संबंधित प्रश्न
Solve the given inequality graphically in two-dimensional plane: x – y ≤ 2
Solve the given inequality graphically in two-dimensional plane: –3x + 2y ≥ –6
Solve the given inequality graphically in two-dimensional plane: 3y – 5x < 30
Solve the given inequality graphically in two-dimensional plane: x > –3
Solve the following inequalities and represent the solution graphically on number line:
3x – 7 > 2(x – 6), 6 – x > 11 – 2x
Solve the inequalities and represent the solution graphically on number line:
5(2x – 7) – 3(2x + 3) ≤ 0, 2x + 19 ≤ 6x + 47
How many litres of water will have to be added to 1125 litres of the 45% solution of acid so that the resulting mixture will contain more than 25% but less than 30% acid content?
Solve the following systems of linear inequation graphically:
2x + 3y ≤ 6, 3x + 2y ≤ 6, x ≥ 0, y ≥ 0
Solve the following systems of linear inequation graphically:
2x + 3y ≤ 6, x + 4y ≤ 4, x ≥ 0, y ≥ 0
Solve the following systems of linear inequations graphically:
x − y ≤ 1, x + 2y ≤ 8, 2x + y ≥ 2, x ≥ 0, y ≥ 0
Solve the following systems of linear inequations graphically:
x + y ≥ 1, 7x + 9y ≤ 63, x ≤ 6, y ≤ 5, x ≥ 0, y ≥ 0
Show that the solution set of the following linear inequations is empty set:
x − 2y ≥ 0, 2x − y ≤ −2, x ≥ 0, y ≥ 0
Find the linear inequations for which the shaded area in Fig. 15.41 is the solution set. Draw the diagram of the solution set of the linear inequations:
Show that the solution set of the following linear in equations is an unbounded set:
x + y ≥ 9
3x + y ≥ 12
x ≥ 0, y ≥ 0
Solve the following systems of inequations graphically:
2x + y ≥ 8, x + 2y ≥ 8, x + y ≤ 6
Solve the following systems of inequations graphically:
12x + 12y ≤ 840, 3x + 6y ≤ 300, 8x + 4y ≤ 480, x ≥ 0, y ≥ 0
Solve the following systems of inequations graphically:
x + 2y ≤ 40, 3x + y ≥ 30, 4x + 3y ≥ 60, x ≥ 0, y ≥ 0
Solve the following systems of inequations graphically:
5x + y ≥ 10, 2x + 2y ≥ 12, x + 4y ≥ 12, x ≥ 0, y ≥ 0
Show that the solution set of the following system of linear inequalities is an unbounded region:
\[2x + y \geq 8, x + 2y \geq 10, x \geq 0, y \geq 0\]
Mark the correct alternative in each of the following:
If x\[<\]7, then
Write the solution of the inequation\[\frac{x^2}{x - 2} > 0\]
Find the linear inequalities for which the shaded region in the given figure is the solution set.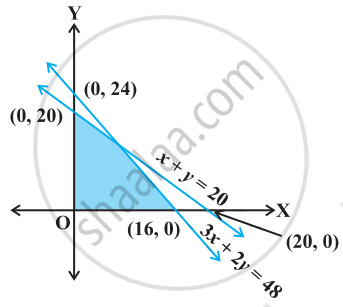
State which of the following statement is True or False.
If xy > 0, then x > 0 and y < 0
State which of the following statement is True or False.
If xy > 0, then x < 0 and y < 0
Solution set of x + y ≥ 0 is