मराठी

From the given diagram, the modal class is:

Advertisements
Advertisements

प्रश्न

From the given diagram, the modal class is:
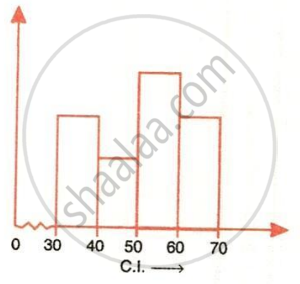
The image displays a statistical histogram featuring a vertical frequency axis with a break or kink at the origin, a horizontal class interval (C.I.) axis ranging from $0$ up to $70$, and rectangular bars representing frequency distributions across the class intervals $30\text{--}40$, $40\text{--}50$, $50\text{--}60$, and $60\text{--}70$.

पर्याय

  • 30-40

  • 40-50

  • 50-60

  • 60-70

MCQ
Advertisements

उत्तर

50-60

Explanation:

From figure,

Class 50-60 has the highest frequency.

shaalaa.com
  या प्रश्नात किंवा उत्तरात काही त्रुटी आहे का?
पाठ 24: Measure of Central Tendency (Mean, Median, Quartiles and Mode) - EXERCISE 24 (C) [पृष्ठ ३८६]

APPEARS IN

सेलिना Concise Mathematics [English] Class 10 ICSE
पाठ 24 Measure of Central Tendency (Mean, Median, Quartiles and Mode)
EXERCISE 24 (C) | Q 1. (e) | पृष्ठ ३८६
Share
Notifications

Englishहिंदीमराठी


      Forgot password?
Use app×