Advertisements
Advertisements
प्रश्न
For the data given in the following table, find:
| Class-mark | Frequency |
| 15 | 10 |
| 25 | 12 |
| 35 | 14 |
| 45 | 16 |
| 55 | 8 |
- mean
- mode (using graph)
- median (using grap)
आलेख
बेरीज
Advertisements
उत्तर
Since the difference between two consecutive class-marks is 10, subtract `10/2` = 5 from each class-mark to get the lower limit and add 5 to get the upper limit.
| Class-mark (x) | Class interval | Frequency (f) | fx | Cumulative frequency |
| 15 | 10 - 20 | 10 | 150 | 10 |
| 25 | 20 - 30 | 12 | 300 | 22 |
| 35 | 30 - 40 | 14 | 490 | 36 |
| 45 | 40 - 50 | 16 | 720 | 52 |
| 55 | 50 - 60 | 8 | 440 | 60 |
| Total | Σf = 60 | Σfx = 2100 |
i. By formula,
Mean = `(Σfx)/(Σf) = 2100/.60` = 35.
Hence, mean = 35.
ii. Calculating mode:
Steps of construction:
- Draw a histogram of the given distribution.
- Inside the highest rectangle, which represents the maximum frequency (or modal class) draw two lines AC and BD diagonally from the upper corners C and D of adjacent rectangles.
- Through the point K (the point of intersection of diagonals AC and BD), draw KM perpendicular to the horizontal axis.
- The value of point M on the horizontal axis represents the value of mode.
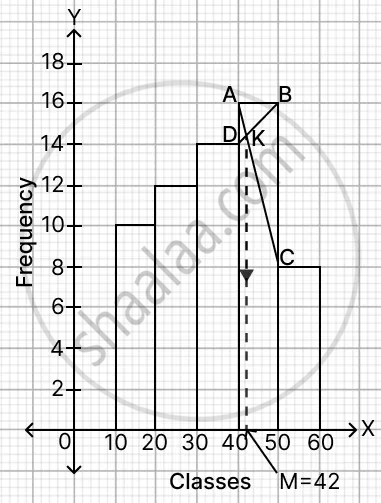
∴ Mode = 42 (approx).
Hence, mode = 42 (approx).
iii. n = Σf = 60
Median = `(n/2)^(th)` term = `60/2` = 30th term.
Steps of construction of ogive:
- Take 1 cm = 10 units along x-axis.
- Take 1 cm = 10 units along y-axis.
- Ogive always starts from a point on x-axis representing the lower limit of the first class. Mark point (10, 0).
- Take upper class limits along x-axis and corresponding cumulative frequencies along y-axis, mark the points (20, 10), (30, 22), (40, 36), (50, 52) and (60, 60).
- Join the points marked by a free hand curve.
- Mark 30 on y-axis, draw a horizontal line which meets the curve at point A.
- Through point A, on the curve, draw a vertical line which meets x-axis at point B.
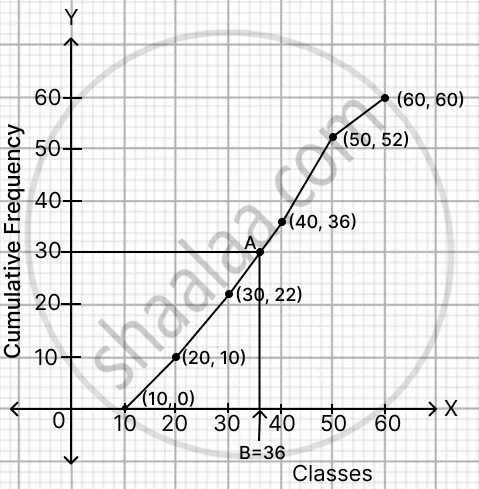
From graph,
B = 36 (approx)
Hence, median = 36 (approx).
shaalaa.com
या प्रश्नात किंवा उत्तरात काही त्रुटी आहे का?
