Advertisements
Advertisements
प्रश्न
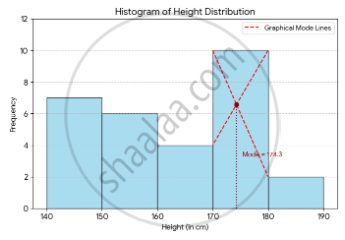
Find the modal height of the following distribution by drawing a histogram:
| Height (in cm) | 140 – 150 | 150 – 160 | 160 – 170 | 170 – 180 | 180 – 190 |
| Frequency | 7 | 6 | 4 | 10 | 2 |
आलेख
Advertisements
उत्तर
Calculation Steps
1. Identify the modal class: Find the class interval with the highest frequency. Here, the frequency 10 is the maximum, so the modal class is 170 – 180.
2. Determine graphical parameters: To find the mode from a histogram, draw two lines intersecting inside the modal bar:
- From the top-left corner of the modal bar to the top-left corner of the next bar.
- From the top-right corner of the modal bar to the top-right corner of the previous bar.
- The x-coordinate of the intersection point is the mode.
3. Apply the mode formula: For a more precise value, use the grouped data formula:
Mode = `L + ((f_1 - f_0)/(2f_1 - f_0 - f_2)) xx h`
Where:
- L (Lower limit of modal class) = 170
- f1 (Frequency of modal class) = 10
- f0 (Frequency of preceding class) = 4
- f2 (Frequency of succeeding class) = 2
- h (Class width) = 10
4. Compute the final value:
Mode = `170 + ((10 - 4)/(2(10) - 4 - 2)) xx 10`
Mode = `170 + (6/14) xx 10`
= 170 + 4.2857
= 174.3
shaalaa.com
या प्रश्नात किंवा उत्तरात काही त्रुटी आहे का?
