Advertisements
Advertisements
प्रश्न
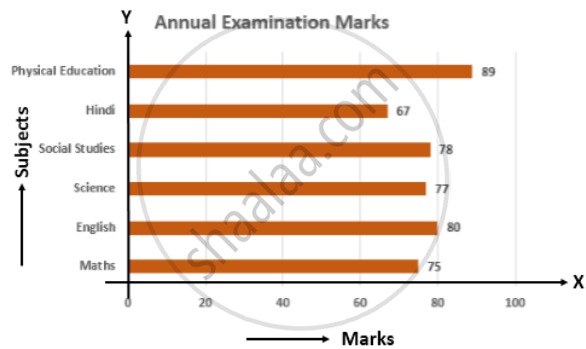
Fadil, a class IX student, scored marks in different subjects (each out of total 100) during his annual examination as given below:
| Subject | Maths | English | Science | Social studies | Hindi | Physical education |
| Mark (out of 100) | 75 | 80 | 77 | 78 | 67 | 89 |
Draw horizontal bar graph for the above data.
Advertisements
उत्तर
The horizontal bar graph is as follows:
APPEARS IN
संबंधित प्रश्न
The number of students in different sections of class IX of a certain school is given in the following table.
| Section | IX-A | IX-B | IX-C | IX-D | IX-E |
| Number of students | 48 | 40 | 50 | 45 | 38 |
Draw horizontal bar graph for the above data.
Draw a histogram for the following frequency distribution:
| Train fare | 0 - 50 | 50 - 100 | 100 - 150 | 150 - 200 | 200 - 250 | 250 - 300 |
| No. of travellers | 25 | 40 | 36 | 20 | 17 | 12 |
The following frequency distribution table shows the cost of living in a city in a period of 2years. Draw histogram for this frequency distribution:
| Cost of living | 2000 - 2500 | 2500 - 3000 | 3000 - 3500 | 3500 - 4000 | 4000 - 4500 | 4500 - 5000 | 5000 - 5500 | 5500 - 6000 |
| No. of months | 3 | 4 | 2 | 5 | 3 | 2 | 4 | 1 |
Draw a histogram for the following frequency table:
| Class interval | 5 - 9 | 10 - 14 | 15 - 19 | 20 - 24 | 25 - 29 | 30 - 34 |
| Frequency | 5 | 9 | 12 | 10 | 16 | 12 |
Draw a histogram for the following cumulative frequency table:
| Marks | Less than 10 | Less than 20 | Less than 30 | Less than 40 | Less than 50 | Less than 60 |
| Number of student | 7 | 18 | 30 | 45 | 55 | 60 |
Draw a histogram for the following cumulative frequency table:
| Class interval | 0 - 10 | 10 - 20 | 20 - 30 | 30 - 40 | 40 - 50 |
| Cumulative frequency | 6 | 10 | 18 | 32 | 40 |
Draw a histogram and a frequency polygon for the following data:
| Marks | 0 - 20 | 20 - 40 | 40 - 60 | 60 - 80 | 80 - 100 |
| No. of students | 12 | 18 | 30 | 25 | 15 |
Draw a histogram and a frequency polygon for the following data:
| Wages | 150 - 200 | 200 - 250 | 250 - 300 | 300 - 350 | 350 - 400 | 400 - 450 |
| No. of workers | 25 | 40 | 35 | 28 | 30 | 22 |
Draw a frequency polygon for the following data:
| Class | 15 - 20 | 20 - 25 | 25 - 30 | 30 - 35 | 35 - 40 | 40 - 45 |
| Frequency | 5 | 12 | 15 | 26 | 18 | 7 |
Draw a frequency polygon for the following data:
| Marks | 5 - 9 | 10 - 14 | 15 - 19 | 20 - 24 | 25 - 29 | 30 - 39 |
| No. of students | 7 | 11 | 15 | 22 | 18 | 5 |
